Employee Sales Dashboard using
تفاصيل العمل
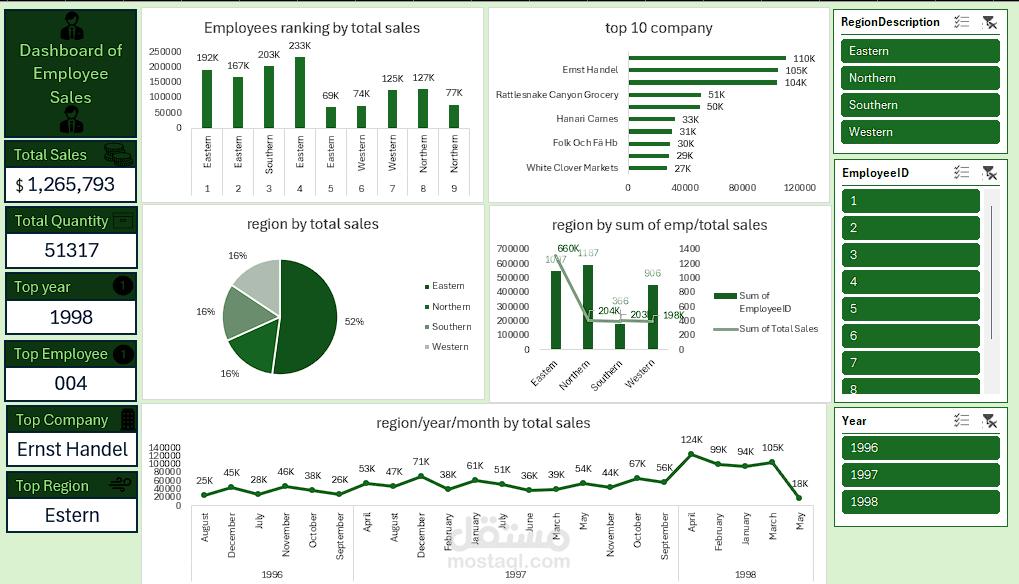
Project: Employee Sales Performance Dashboard
Tools: Excel, Power Query, Power Pivot
Description:
I designed an interactive dashboard to visualize employee sales performance. The dashboard highlights:
Employee ranking by total sales.
Top 10 companies by sales.
Regional comparison (Eastern, Northern, Southern, Western) by sales and employee count.
Sales trends across years and months.
Key insights including the best year, top employee, top company, and best-performing region.
Value:
This dashboard enables management to easily track performance, identify top-performing employees, and pinpoint the most profitable regions for better decision-making.