Interactive Dashboard For candy Factory
تفاصيل العمل
Project: Candy Factory Sales Dashboard
Tools: Excel, Power Query, Power Pivot
Description:
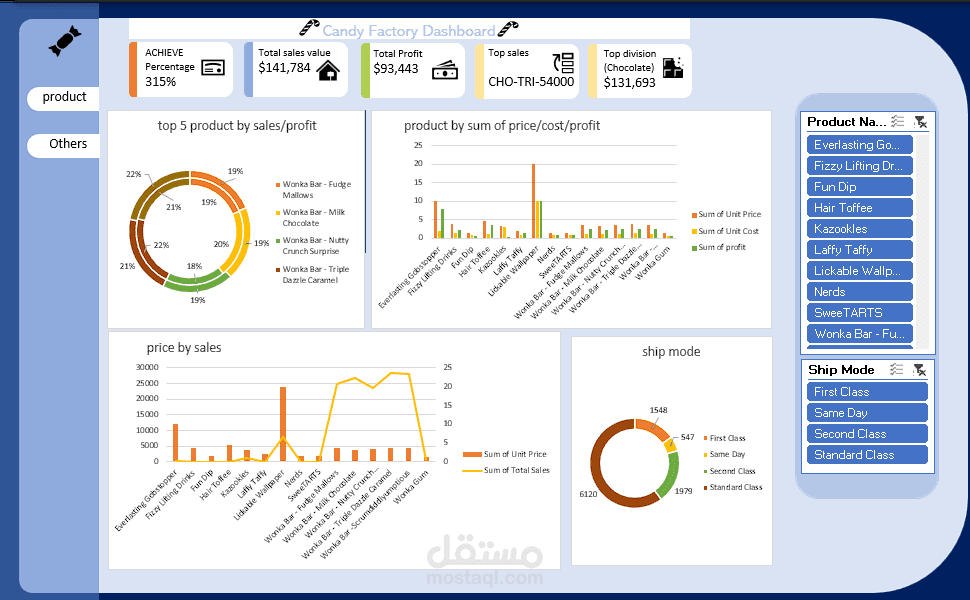
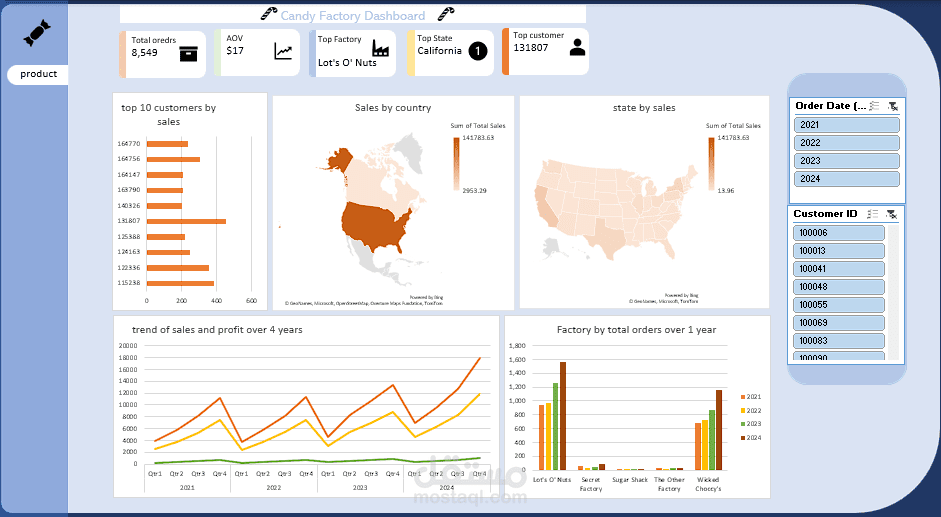
I designed an interactive dashboard to analyze and monitor the sales performance of a candy factory. The dashboard provides clear insights into:
Top 5 products by sales and profit.
Product comparison by price, cost, and profit.
Sales and pricing trends over time.
Shipping method analysis (First Class, Same Day, Second Class, Standard Class).
Value:
This dashboard helps management track the most profitable products, optimize pricing strategies, and choose the best shipping methods based on real data.