interactive Sales Dashboard
تفاصيل العمل
Project: Interactive Sales Dashboard
Tools: Excel, Power Query, Power Pivot
Description:
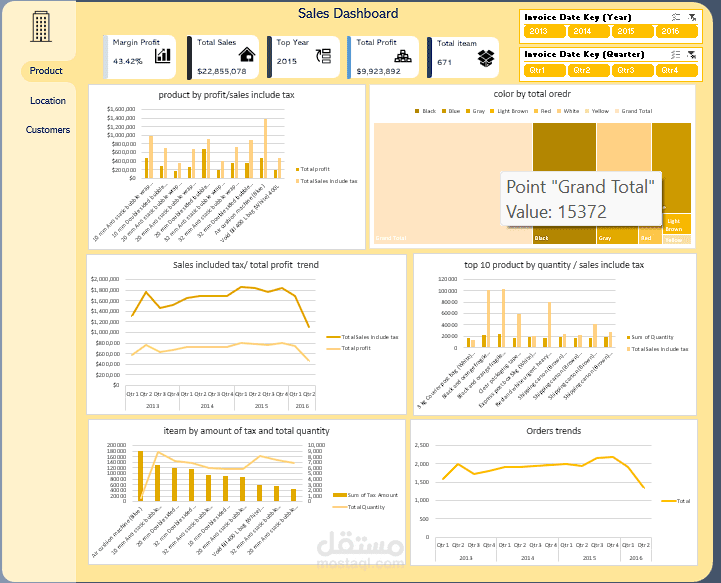
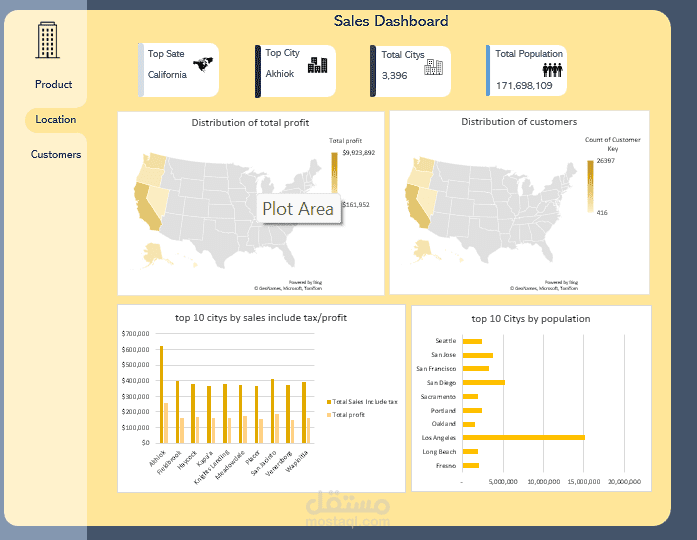
I designed an interactive dashboard that highlights key sales performance indicators such as total sales, profit, best year, number of orders, and top-selling products.
Features:
Sales and profit trends across multiple years.
Product comparison based on profit and quantity.
Order analysis by colors and time periods.
Tracking total taxes and quantity sold.
Automated data cleaning with Power Query.
Data modeling and KPIs using Power Pivot.
Multiple dynamic charts in Excel for clear insights.
Goal: Simplify performance tracking and transform raw data into actionable insights that support decision-making.