تحليل الارباح
تفاصيل العمل
1️⃣ Data Collection & Cleaning – ensuring accuracy and consistency.
2️⃣ Data Structuring – organizing information for efficient analysis.
3️⃣ Pivot Tables & Calculations – extracting key metrics and trends.
4️⃣ Interactive Visual Design – creating a clear and engaging dashboard.
Key Highlights:
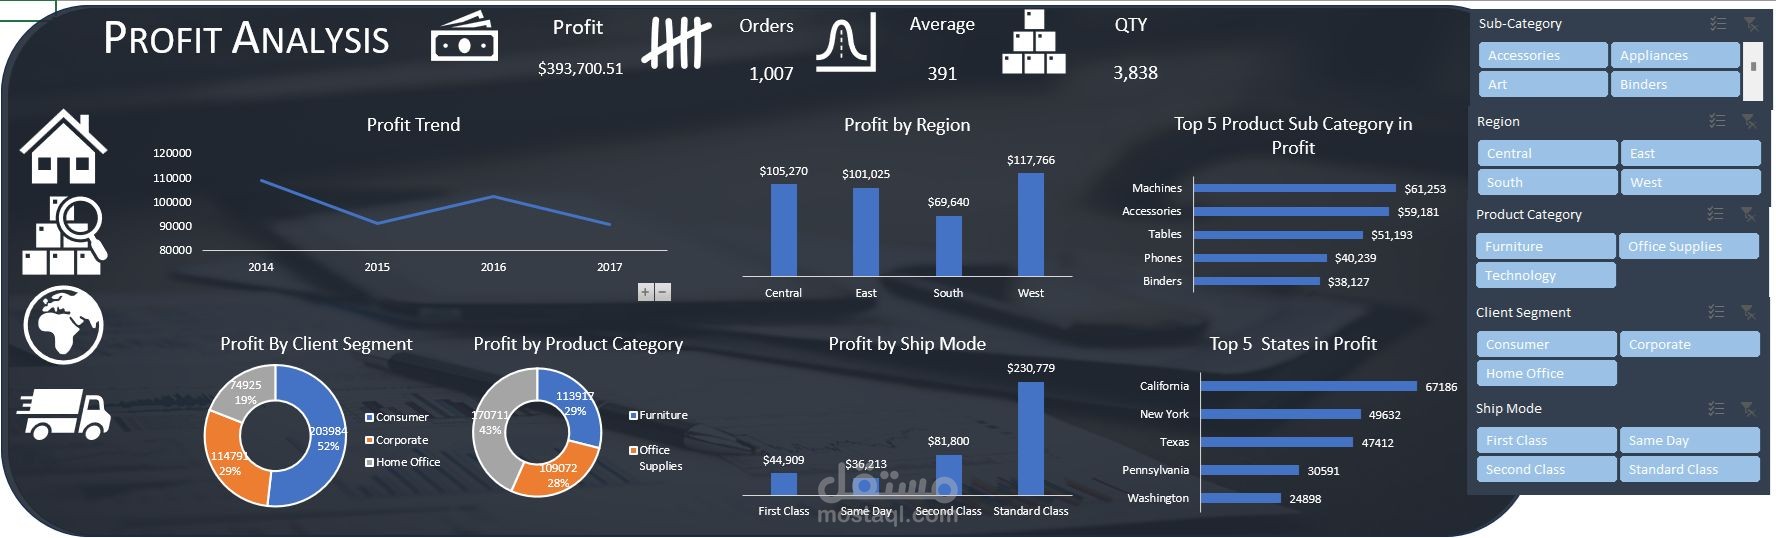
Total Profit: $393,700.51
Top Region: West ($117K)
Most Profitable Sub-Category: Machines ($61K)
Leading State: California (~$67K)
The dashboard includes interactive filters by region, product category, client segment, and shipping mode — enabling stakeholders to explore the data their way.