كاس العالم
تفاصيل العمل
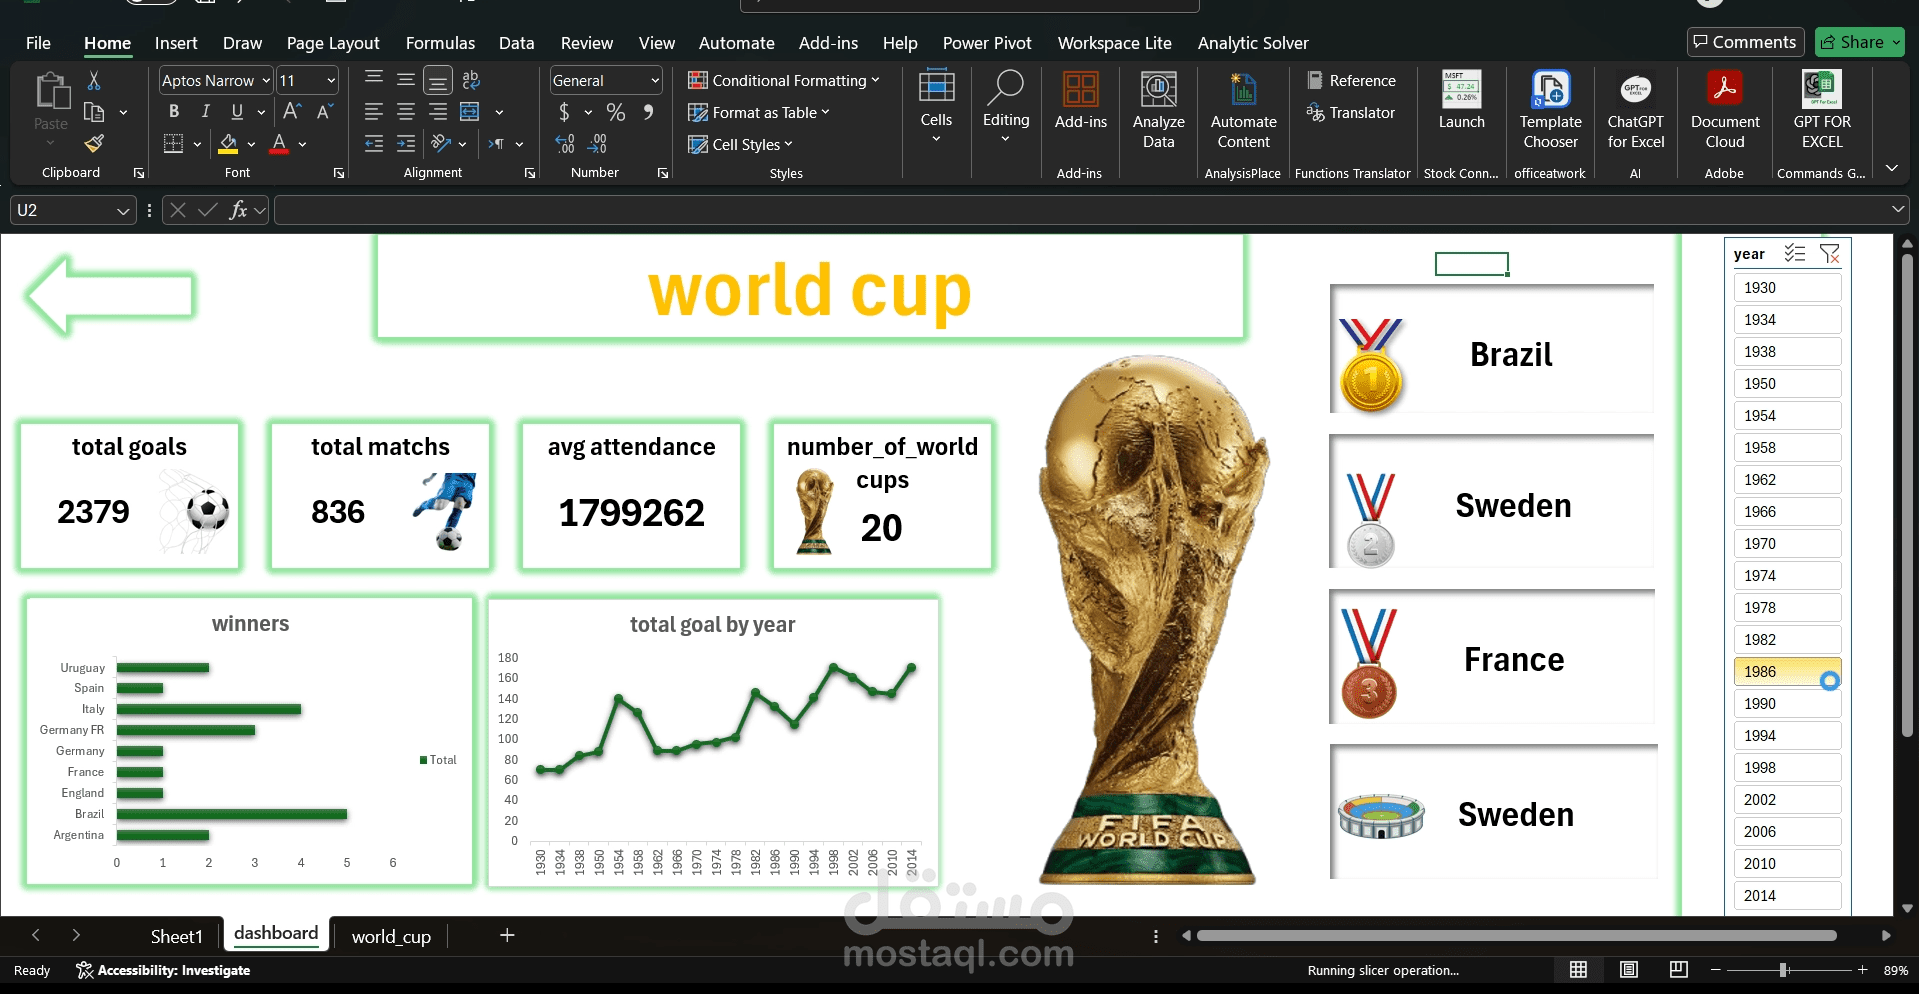
In this project, I worked with real-world data and used:
Power Query to clean and transform the data
Power Pivot to build the data model and create relationships
Pivot Tables & Slicers to build an interactive dashboard
The dashboard includes key insights like:
World Cup winners by year
Top-performing teams
Hosts and overall results summary