Student Performance Analysis and Intervention Strategy
تفاصيل العمل
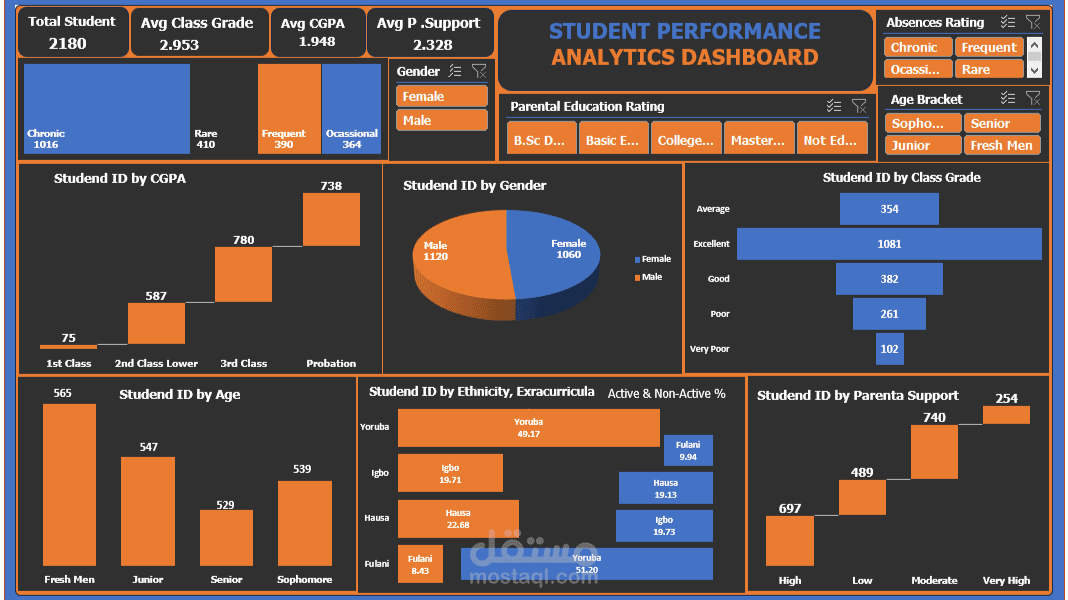
Objective: Analyze student academic data to identify at-risk students and recommend targeted interventions to improve performance.
? Tools & Tech:
Python (Pandas, Matplotlib, Scikit-learn)
Excel or Google Sheets
Power BI or Tableau for dashboards
Dataset Includes:
Student demographics (age, gender, socioeconomic status)
Attendance records
Grades across subjects
Participation in extracurriculars
Final exam results
Workflow:
Clean and preprocess the data
Perform correlation analysis between attendance, activities, and grades
Use classification models (e.g., decision tree) to predict risk of failure
Visualize performance trends across different groups
Recommend interventions (e.g., tutoring, mentorship)
Outcome: Identified that students with <80% attendance and no extracurriculars were 3× more likely to fail. Proposed a mentorship program and tracked improvement over time.