Sales Anaysis
تفاصيل العمل
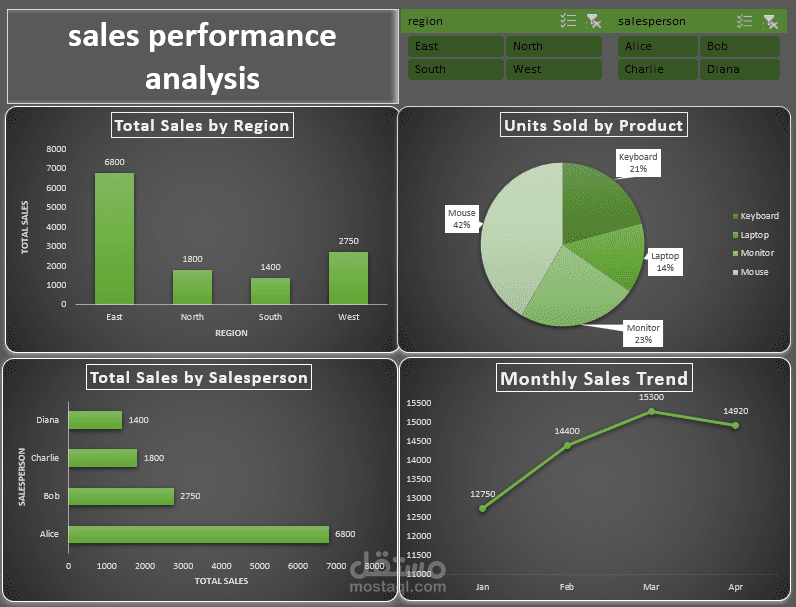
This project focuses on transforming sales data using Power Query to clean columns, adjust data types, and add calculated columns. The results are then summarized using PivotTables to display sales by region, rep, product, and time. The charts are then integrated into an interactive dashboard with clear visual indicators and filter sliders, enabling easy performance analysis and supporting decision-making based on accurate, structured data.