مبادره رواد مصر الرقميه
تفاصيل العمل


Over the past 4 days, I’ve been working on a new project that really pushed my skills in data analytics and visualization.
The project was based on a marketing campaign analysis for a company, where I had to:
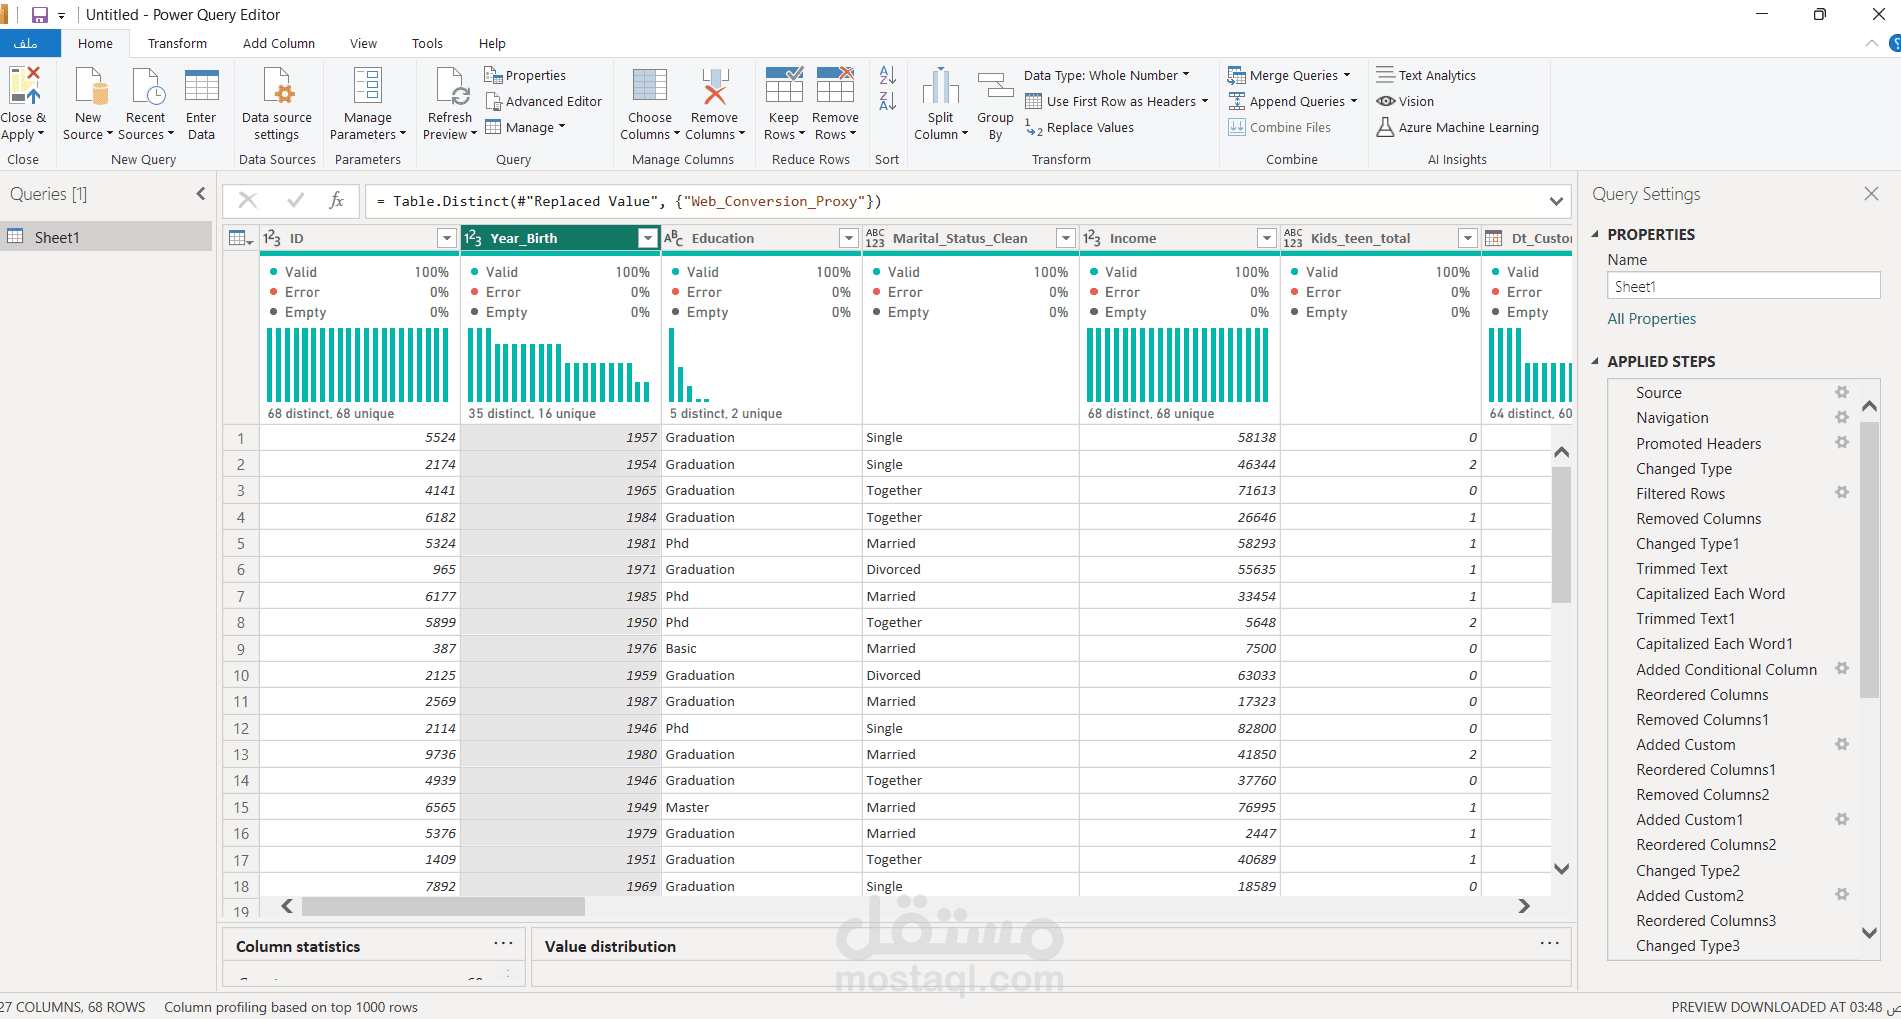
Understand and explore the raw dataset in depth.
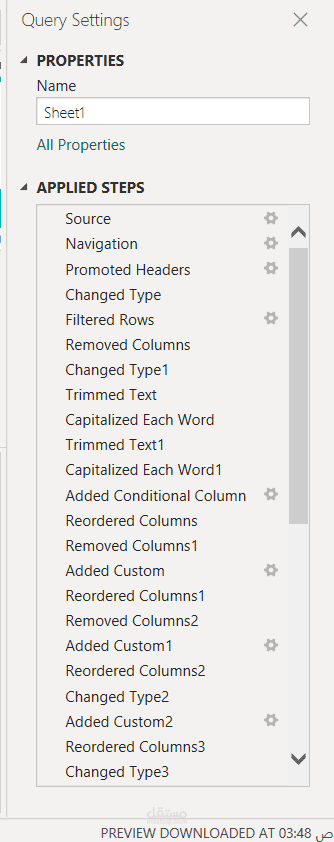
Clean and transform the data to ensure accuracy and reliability.
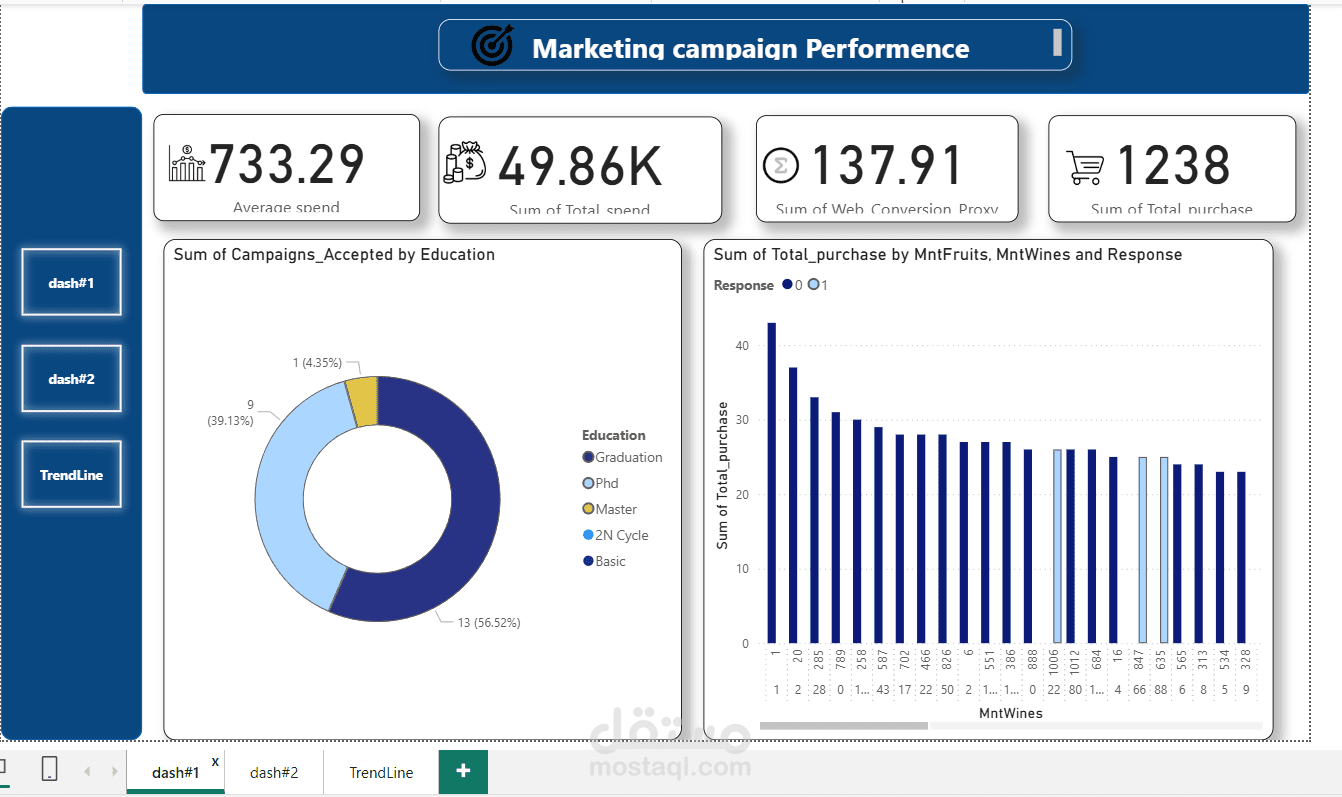
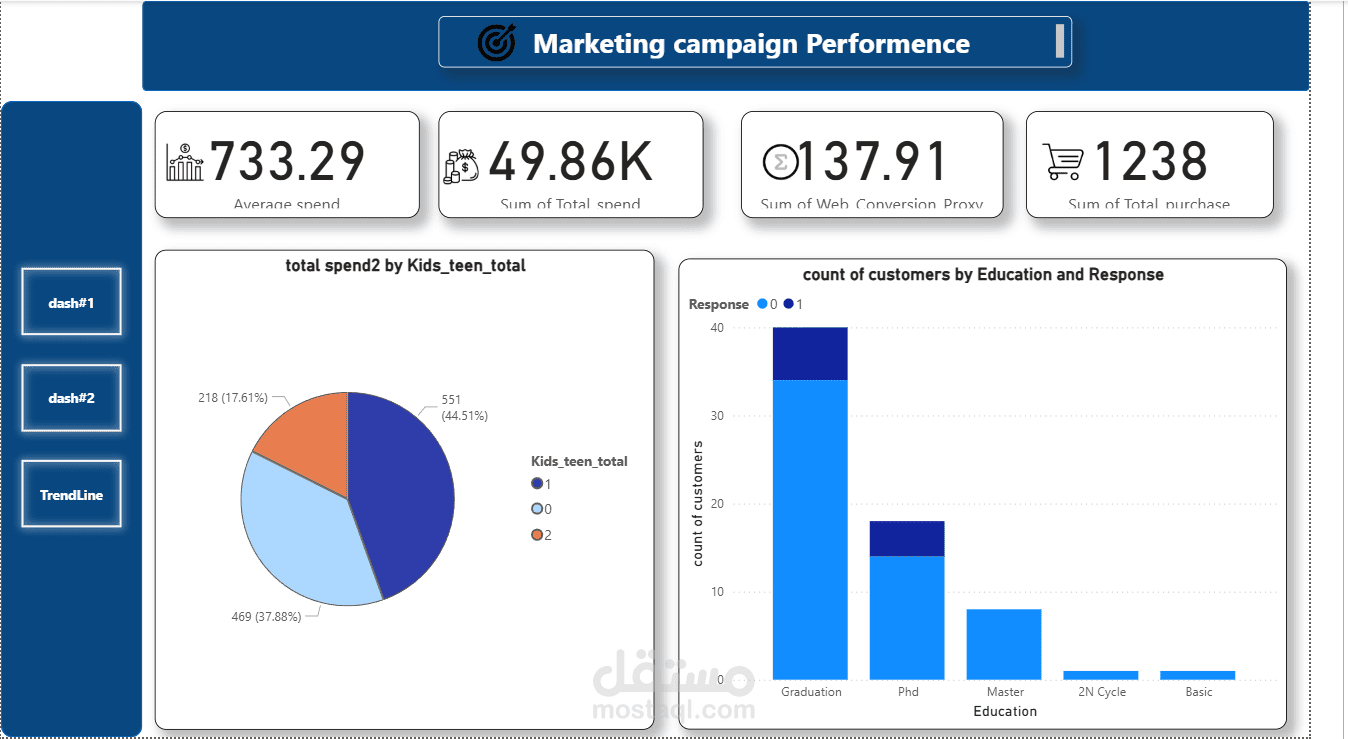
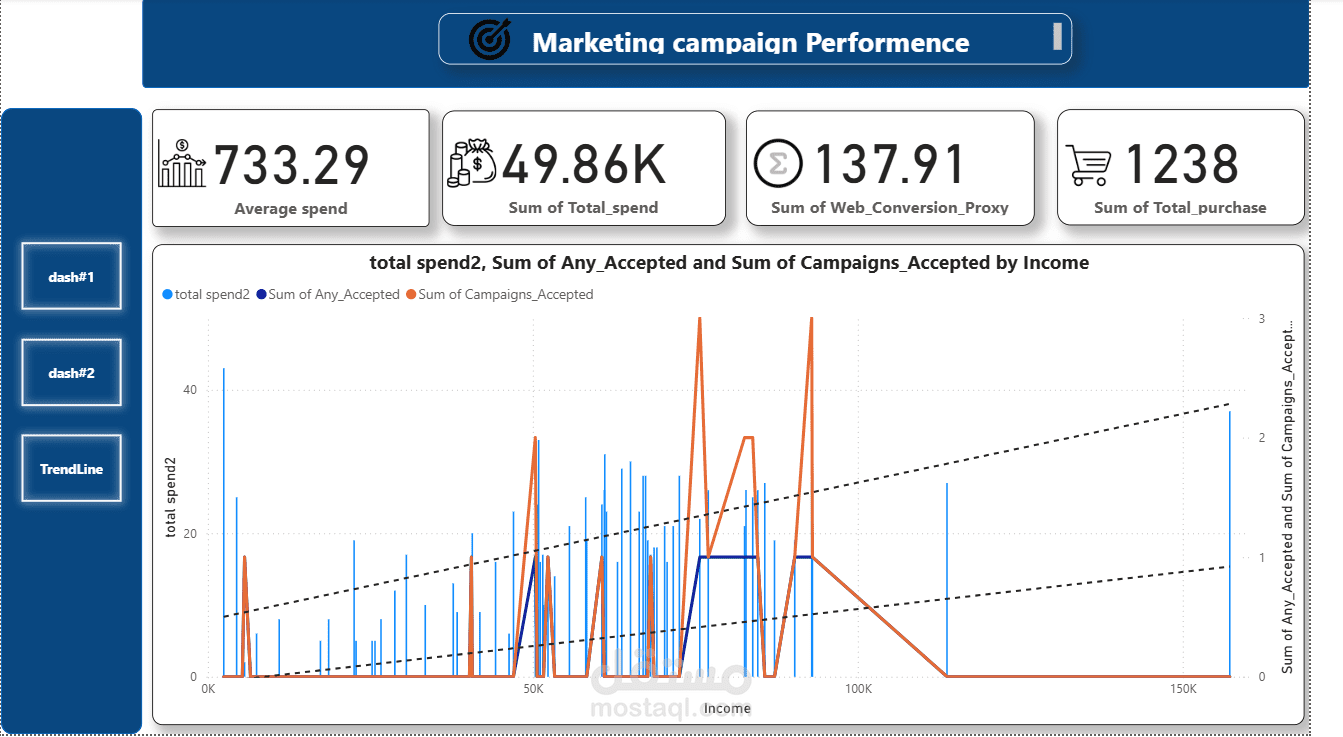
Design and build an interactive Power BI dashboard that highlights the key marketing insights and outcomes.
For the first time, I also started applying DAX formulas to create dynamic measures and ensure the numbers in the dashboard reflect the business reality in a clear and actionable way.
This experience helped me connect the dots between data preparation, business logic, and storytelling through dashboards. It was a challenging but rewarding process that sharpened both my technical and analytical thinking.
I’m excited to keep building on this journey and to deliver even more impactful dashboards in upcoming projects!