HR dashboard
تفاصيل العمل
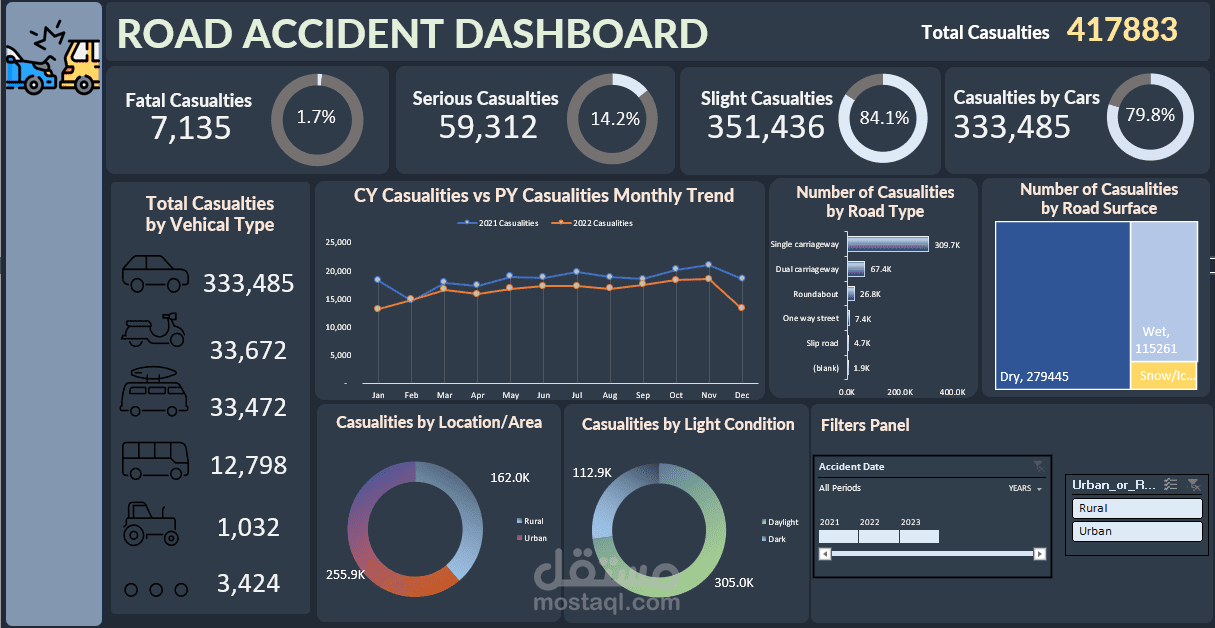
Road Accident Dashboard – Excel Project
This Road Accident Dashboard was built in Excel to provide a comprehensive visual analysis of traffic accident data, helping stakeholders identify high-risk factors and prioritize safety measures.
Key Insights & Features:
Overall Summary: Displays total casualties (417,883) broken down into fatal (7,135), serious (59,312), and slight (351,436) cases.
Vehicle Type Analysis: Highlights casualties by vehicle category, with cars accounting for the majority (79.8%).
Trend Analysis: Compares current year vs. previous year monthly casualty trends using a dynamic line chart.
Road Conditions Impact:
Road Type: Single carriageways have the highest casualties (309.7K).
Road Surface: Majority occur on dry surfaces (279,445), followed by wet (115,261) and icy/snowy conditions.
Demographic & Environmental Factors:
Casualties by location (urban vs. rural).
Casualties by light condition (daylight vs. dark).
Interactive Filters: Enables users to slice data by accident date, location type, and other factors for focused analysis.
Clean, Insightful Visual Design: Leveraged Excel charts, conditional formatting, shapes, and slicers to build an interactive, user-friendly dashboard.
Impact:
This dashboard supports policymakers, transport authorities, and safety analysts in identifying accident-prone conditions, monitoring trends over time, and improving road safety strategies.