sales of Chocolate
تفاصيل العمل
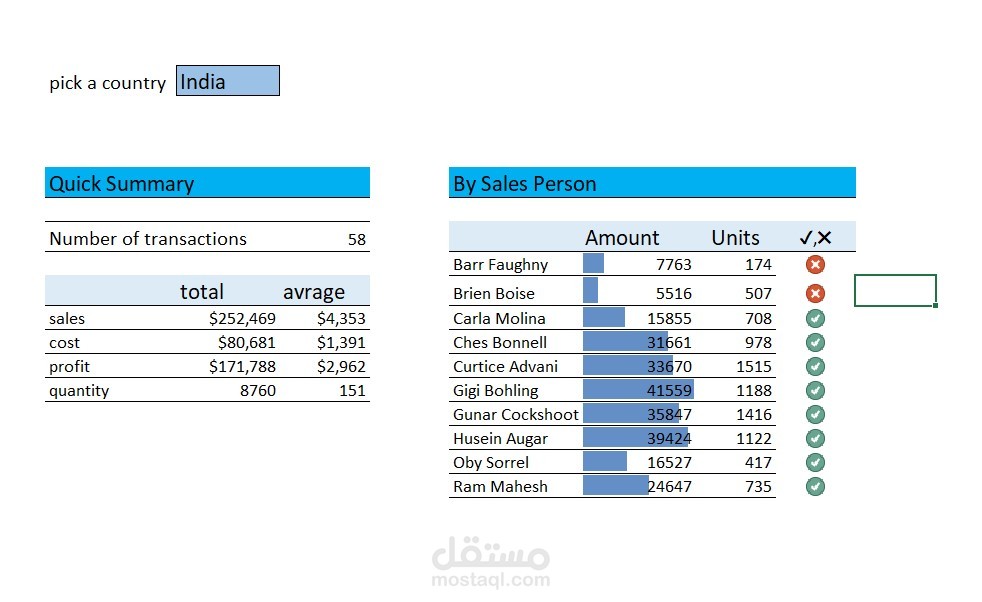
I designed and built an interactive Excel dashboard to analyze sales performance by country and salesperson.
Key Features:
Country Selection (Drop-down filter): Allows users to pick a country (e.g., India) and instantly update the dashboard results.
Quick Summary Section:
Number of transactions: 58
Total & Average Sales: $252,469 / $4,353
Total & Average Cost: $80,681 / $1,391
Total & Average Profit: $171,788 / $2,962
Quantity sold: 8,760 units (avg. 151)
Sales by Person:
Visual bar chart alongside amount & units per salesperson.
Conditional check ( / ) to evaluate salesperson performance.
Dynamic Calculations: All metrics update automatically when selecting a different country.
Professional Design: Used clean formatting, color coding, and conditional icons for better readability.
My Contribution:
Built everything on Excel (without external tools).
Applied formulas, conditional formatting, and data validation to automate insights.
Designed a clear and professional layout for quick decision-making.