Olist E-commerce SQL Analysis
تفاصيل العمل
Olist E-commerce SQL Analysis
Project Overview
This project explores the Brazilian Olist e-commerce dataset using SQL (PostgreSQL) to uncover insights into sales, customer behavior, operations, and customer experience.
The goal is not just querying data, but also:
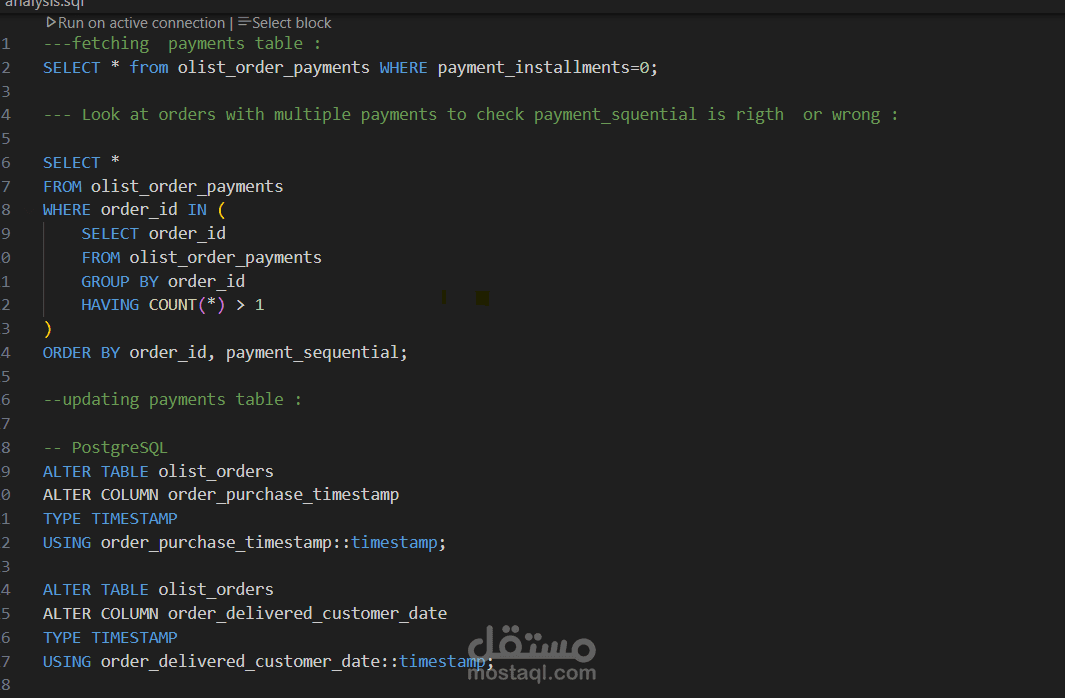
️ **fixiing realtions between tables and make validiation
️ Showcasing SQL mastery (window functions, CTEs, aggregations).
Deriving business insights (churn, logistics inefficiencies, retention).
Recommending data-driven actions to improve performance.
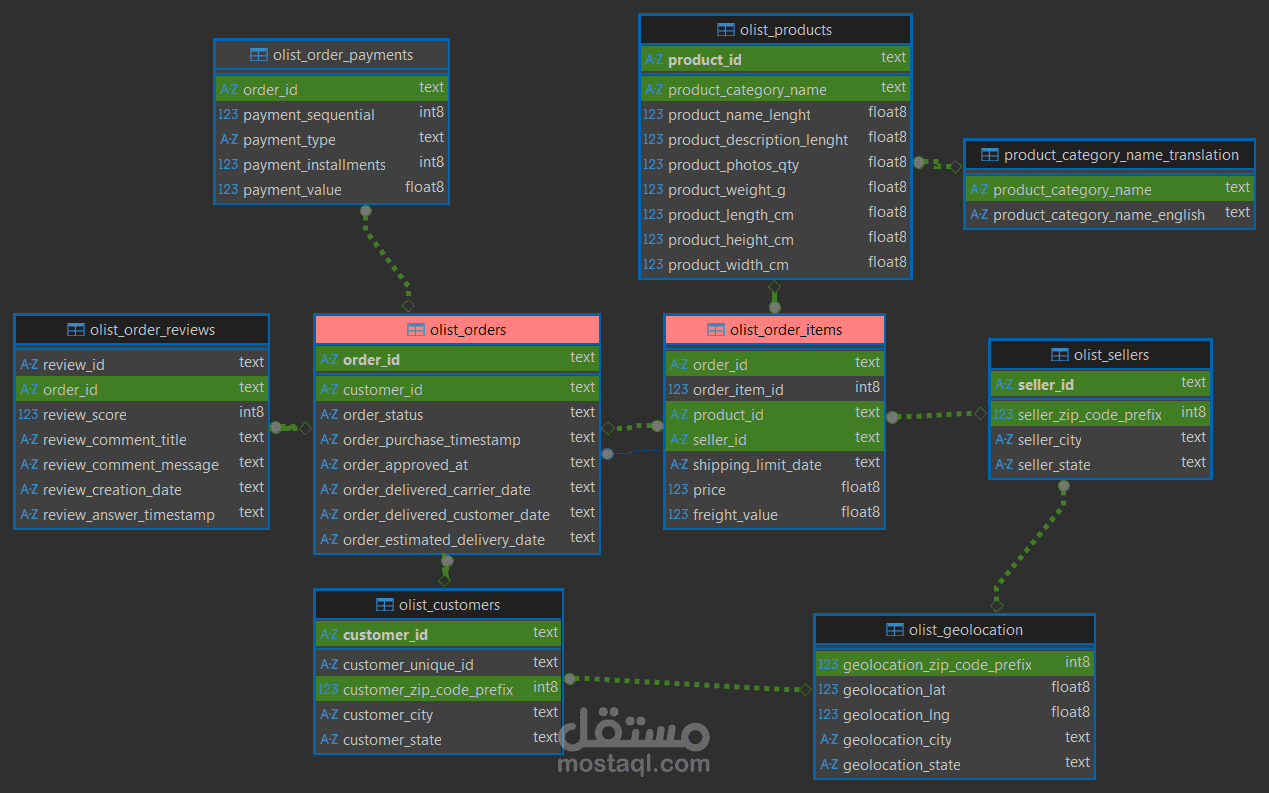
️ Dataset
The dataset contains multiple interconnected tables:
olist_orders – orders with timestamps & statuses
olist_order_payments – payment methods & installments
olist_order_items – products, prices, freight
olist_customers – customer IDs & geolocation
olist_products – product categories
olist_order_reviews – customer feedback
Key Business Questions & Metrics
Sales Metrics
Total Revenue & Average Order Value (AOV)
Number of Orders per Month
Revenue by Product Category
Customer Metrics
Retention Rate (CRR)
Repeat vs. One-time Customers
Customer Lifetime Value (CLV)
Operations Metrics
Average Delivery Time
Late Delivery Rate
Freight % of Total Order Cost
⭐ Experience Metrics
Average Review Score by Category
% of 5-star vs. 1-star Reviews
Impact of Delivery Time on Review Score
Key Findings
Churn & Retention
Only ~X% of customers return → low retention.
Long delivery times strongly correlate with low ratings & churn.
Delivery Performance
Many orders take >20 days to deliver.
Freight cost is already ~14% of total purchase value, yet delivery speed is poor.
Customer Experience
5⭐ reviews drop sharply when delivery exceeds 20 days.
Categories like books perform best in satisfaction.
️ Furniture/electronics struggle due to slow logistics.
Business Recommendations
Logistics Optimization: Reduce delivery >20 days by partnering with faster carriers or regional warehouses.
Retention Strategy: Segment churn-risk customers (long delivery + low review) and target with free shipping vouchers / discounts.
Freight Cost Management: Reallocate part of the 14% freight spend into faster delivery options.
Monitoring Dashboard: Track SLA (% of orders delivered in 7 / 15 / 20+ days) and connect with review scores monthly.