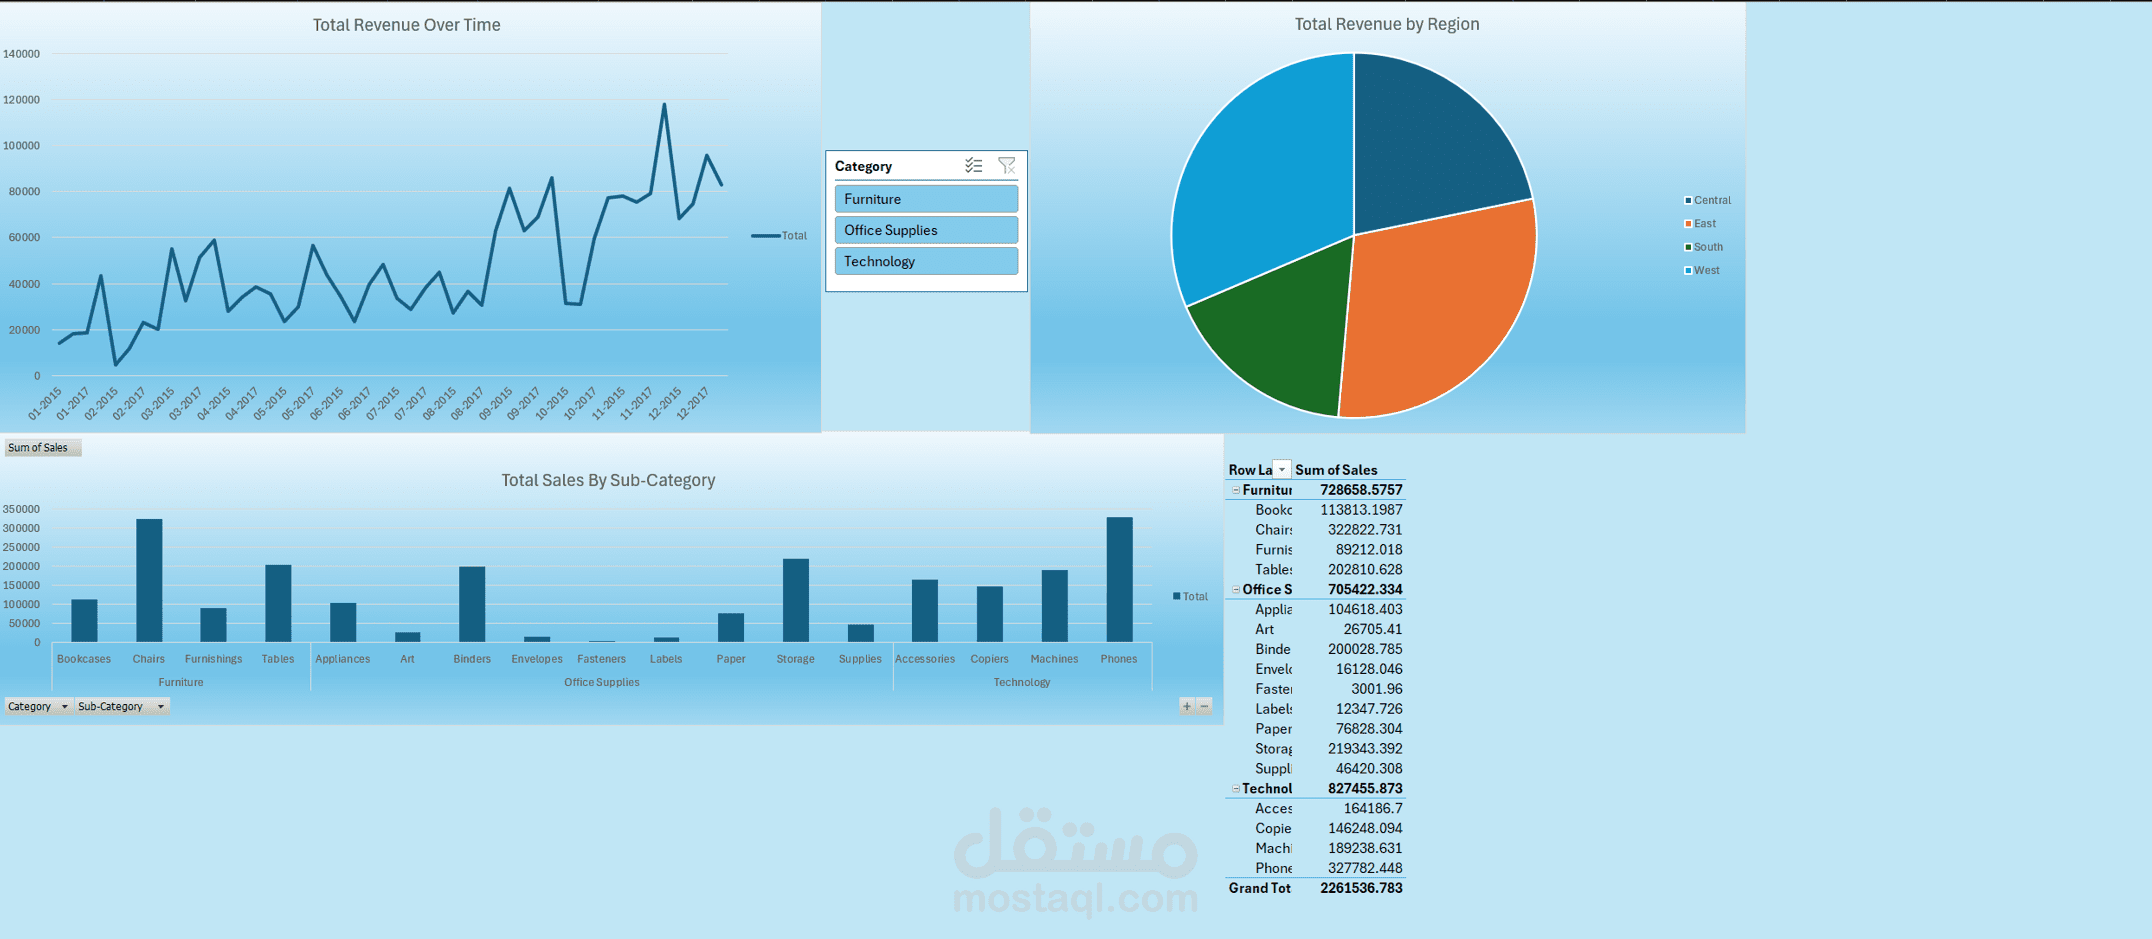
Sales Performance Dashboard Using Excel
تفاصيل العمل
Imported a simple sales dataset into Excel
Cleaned and organized the data using formatting and formulas
Pivot tables to summarize key metrics: total revenue, units sold, monthly trends
Clean, Readable charts to Visualize Overall Performance
Used Filters\Slicers

