BMW Global Sales Analysis – Power BI Report
تفاصيل العمل
In this project, I conducted an in-depth analysis of BMW global sales data to extract insights that highlight market trends, revenue distribution, and sales performance across regions and time.
Methodology:
1. Data Preparation
- Cleaned and standardized data related to models, fuel type, transmission, engine size, mileage, and pricing.
- Created calculated columns for classification such as Car_Age, Age_Category, Mileage_Category, Eco_Category, Price_Category.
2. Data Modeling
-Built a Star Schema model including:
Fact_Sales (sales volume, revenue, pricing).
Dimension tables (Dim_Model, Dim_Region, Dim_Time) to support flexible analysis.
3. DAX Measures
- Developed core KPIs: Total Revenue, Total Sales Volume, Average Price.
Implemented dynamic formatting to display values in appropriate units (K / M / B / T).
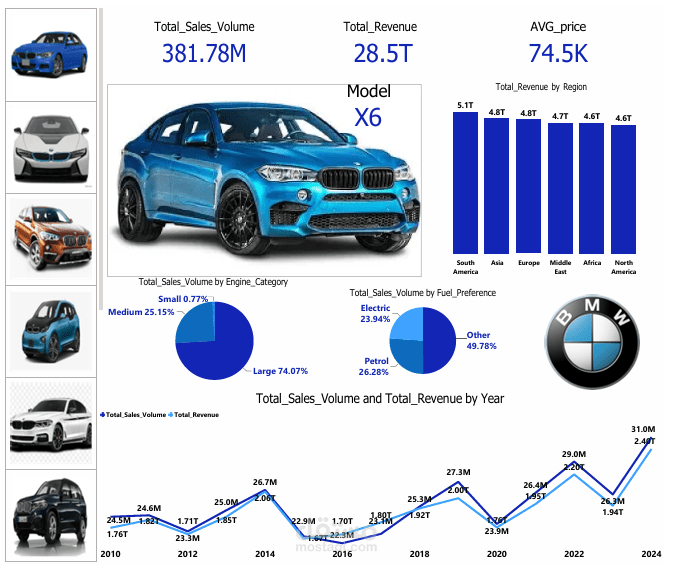
4. Dashboard Design
-Integrated model images as interactive slicers, enabling users to view complete details for each selected model.
- Designed clear KPI cards and multiple visualizations to highlight:
Sales and revenue trends over time.
Geographic distribution of sales.
Sales share by fuel type and engine size.
Key Insights:
- Total Sales Volume: approx. 380M – 416M units during the analyzed period.
- Average Price per Car: around 74K USD.
- Total Revenue: ranged between 28T – 31T USD globally.
- Top Regions: North America and Asia together contributed more than 10T USD in revenue.
- Engine Size: Large engines accounted for nearly 74% of total sales.
- Eco-Friendly Vehicles (Electric + Hybrid) captured a growing share of ~25%.
- The strongest sales period was 2016 – 2020, followed by a slight decline in 2024.
Conclusion:
This analytical model provides a comprehensive decision-support tool that enables BMW stakeholders to:
- Identify the most profitable markets.
- Monitor sales and revenue trends across years.
- Assess the impact of electric and hybrid vehicles on market share.
Recognize the top-performing models.