Candy line sales overview
تفاصيل العمل
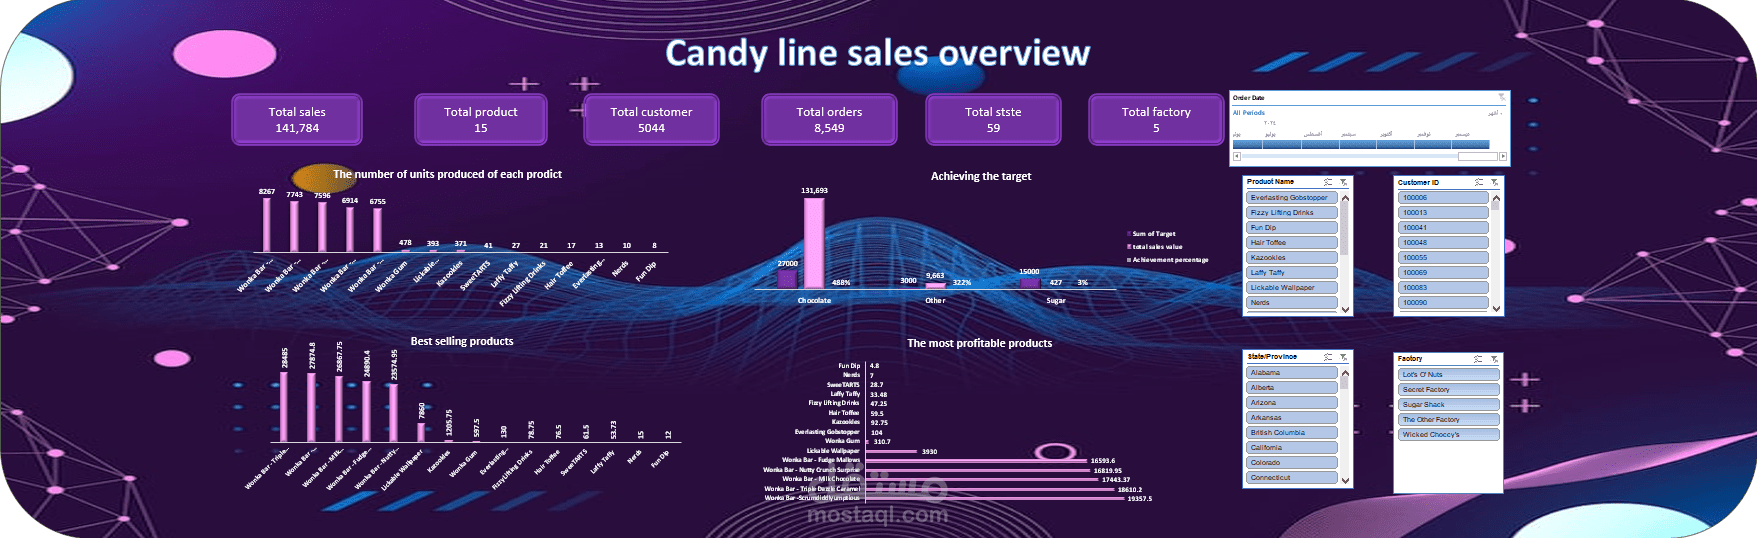
Candy Line Sales Overview
️ This interactive dashboard was designed using:
Power Query
Power Pivot
Pivot Table
This dashboard provides a comprehensive overview of the candy production line, highlighting the most important KPIs:
Total Sales: 141,784
Total Products: 15
Total Orders: 8,549
Additionally, it illustrates:
Sales trend over the company’s operating period.
Top-selling products.
Top-performing factories.
This project was a great opportunity to apply what I’ve learned in practice, helping me to further develop my skills in data analysis and building more clear and professional interactive dashboards.