Sales performance dashboard
تفاصيل العمل
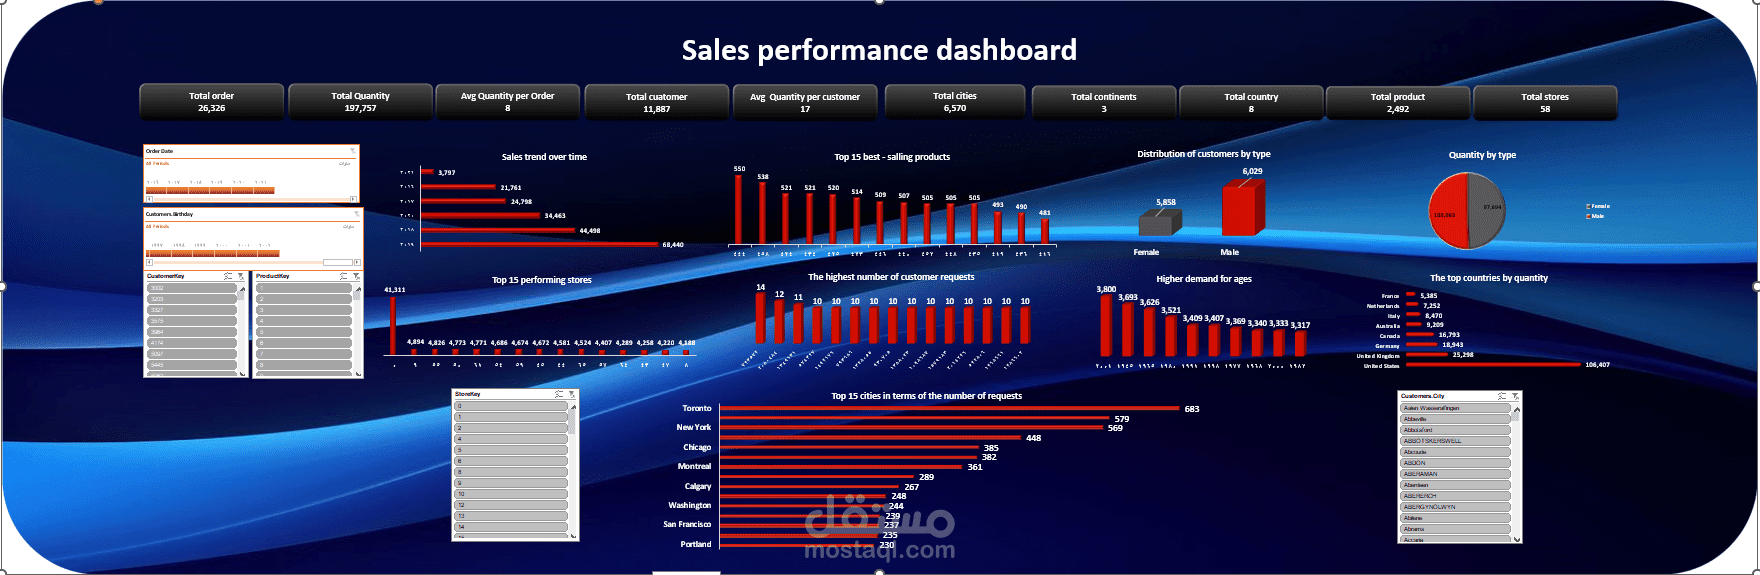
Sales Performance Dashboard
This dashboard was created using Microsoft Excel with the following tools:
Power Query
Power Pivot
Pivot Table
The dashboard highlights key insights that support decision-makers, including:
Total Quantity Sold: 197,757
Total Orders: 26,326
Total Products: 2,492
It also provides valuable insights such as:
Sales trends over time
Top-selling products
Cities with the highest sales volume
Through this project, I learned how to transform and prepare raw data to deliver clear and meaningful insights for decision-makers.