My portfolio
تفاصيل العمل
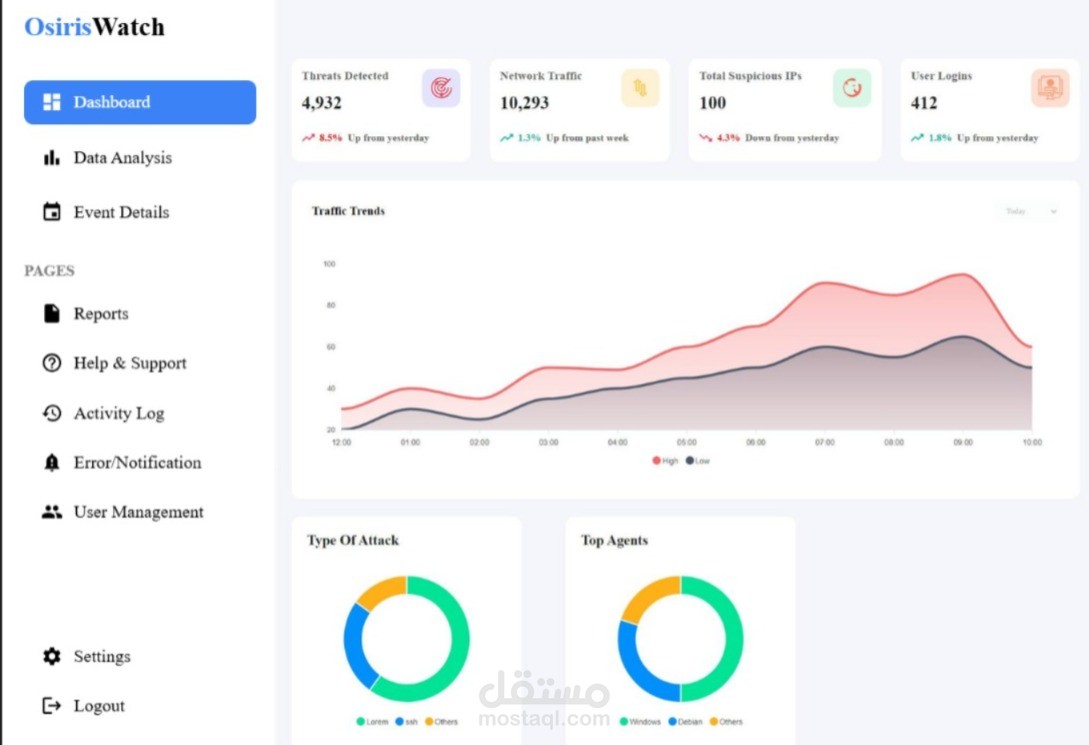
A dashboard that organizes and visualizes IDs network data in a clear way
Includes a Data Analysis Page with numbers and charts for quick insights
Designed with a blue and white palette for clarity and usability
Helps clients track performance and make faster, more accurate decisions
Saves time by replacing manual tracking with an interactive interface