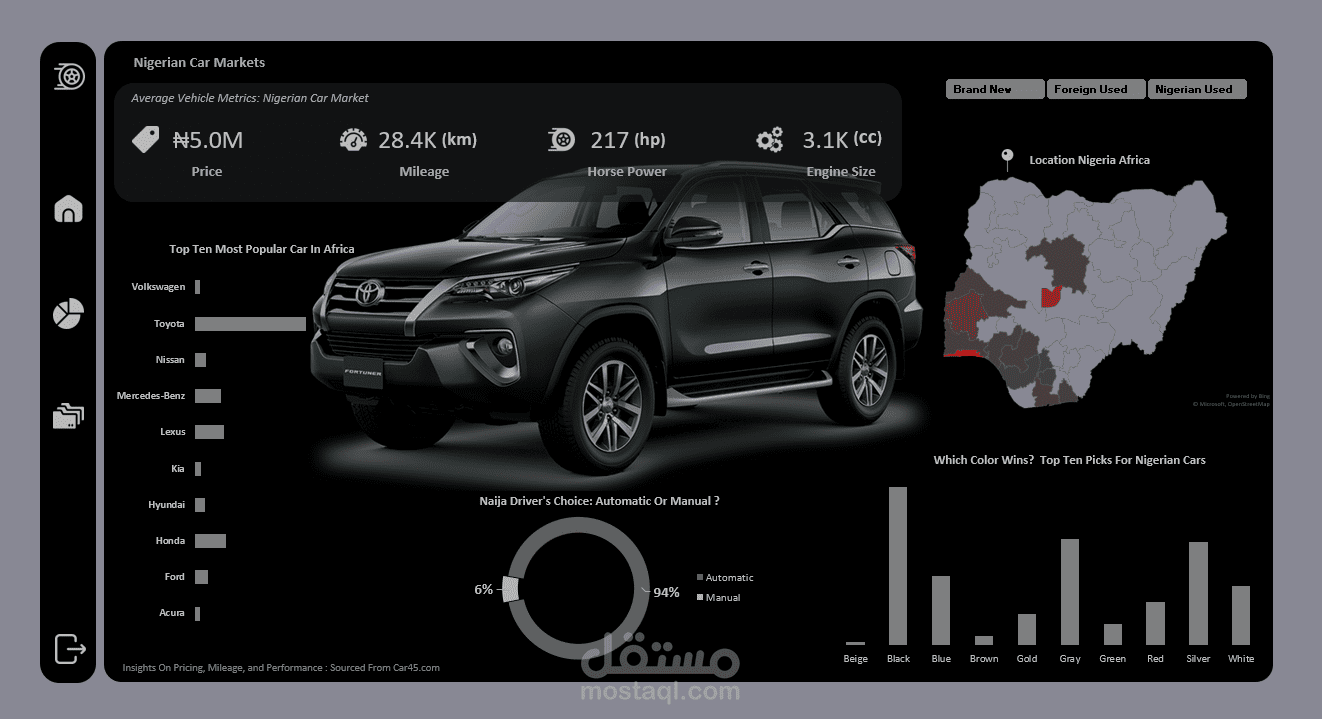
تحليل بيانات شامل مع تقارير ورسوم بيانية باستخدام Excel وPower BI
تفاصيل العمل
Sales Performance Dashboard
This dashboard presents key sales metrics such as total sales, revenue, profit, quantity sold, and unit price. It includes visual charts showing
monthly and yearly trends, as well as regional sales comparisons across different states.The dashboard helps track business performance
and supports data-driven decision-making
