Shoes Online Business Analysis
تفاصيل العمل
تحليل بيانات تابعة لشركة تخزين وتسويق، والثانية لشركة شحن. كانت البيانات غير منظمة، فوضوية، ومكتوبة بالكامل باللغة العربية، مما أضاف طبقة إضافية من التعقيد إلى عملية التحليل. نفذت كامل مراحل العمل باستخدام Excel، بدءًا من استكشاف البيانات وتنظيفها لضمان الاتساق والدقة، وصولًا إلى عمل الداشبورد النهائية.
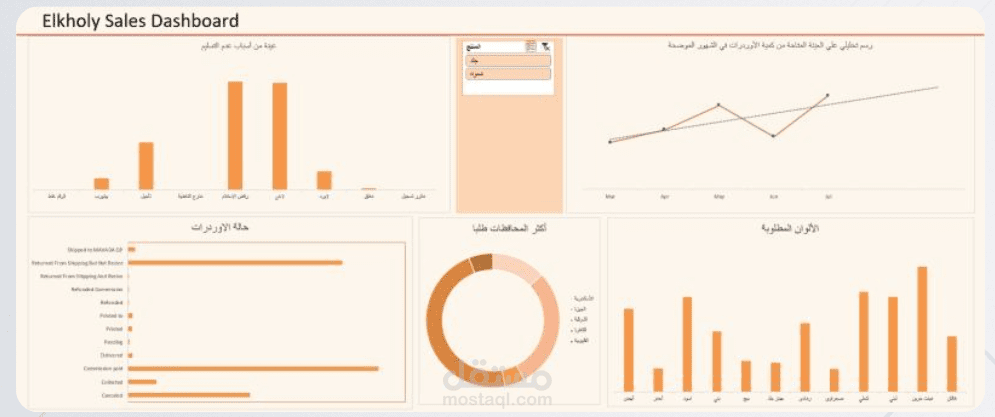
النتيجة النهائية كانت لوحة معلومات ديناميكية وتفاعلية (داشبورد) تتيح للمستخدمين التنقل بين المؤشرات الرئيسية والاتجاهات بكل وضوح. تضمنت الداشبورد عناصر تحليلية متعددة، منها:
رسم خطي عدد الاوردرات الشهرية
تحليل اسباب عدم استلام الاوردرات من العملاء
تحليل حالة الاوردرات
أكثر المحافظات طلبا
تحليل للألوان المطلوبة
كل هذه العناصر تم تصميمها داخل Excel باستخدام أدوات متقدمة مثل PivotTables، Slicers، الرسوم البيانية الديناميكية، مما يوفّر تجربة تحليلية مرنة وسهلة للمستخدم النهائي، ويعكس قدرة عالية على التعامل مع البيانات العربية المعقدة وتحويلها إلى رؤى قابلة للتنفيذ.