Sales Analysis for Beverage products
تفاصيل العمل
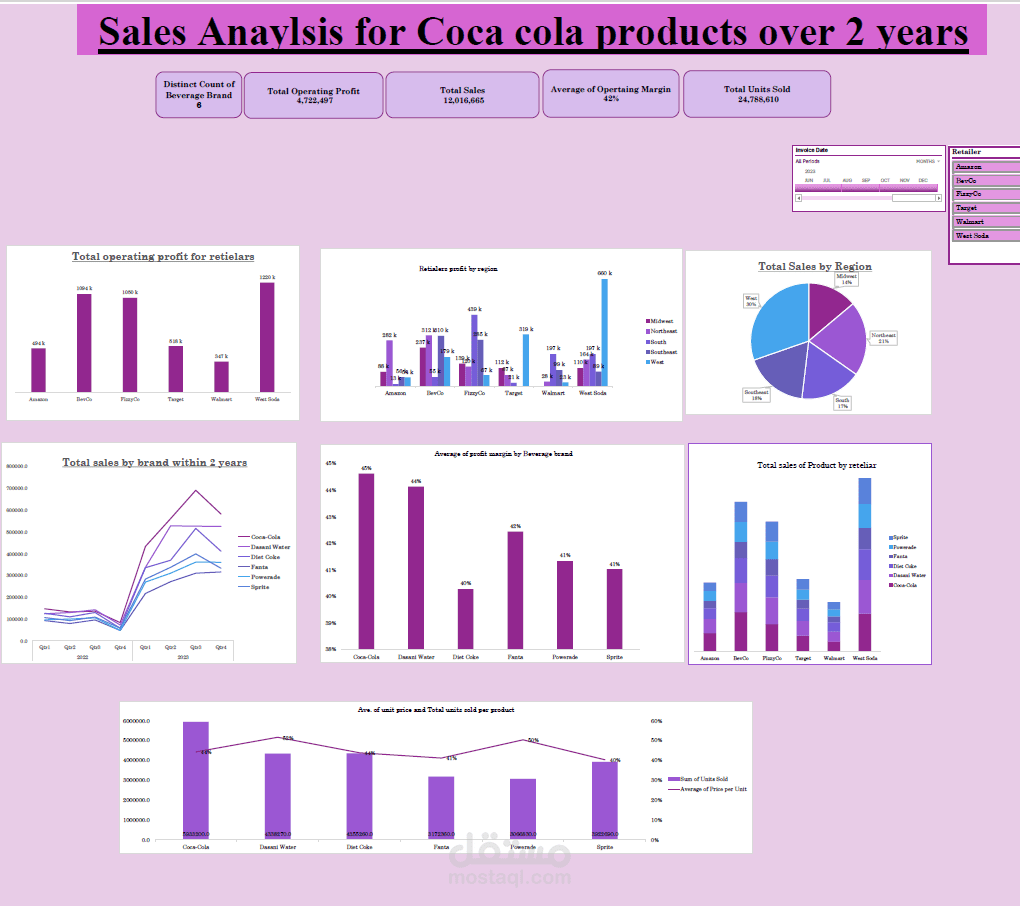
Coca-Cola Sales Analysis Dashboard (2 Years)
Designed a dashboard to analyze Coca-Cola product sales performance across different brands, regions, and retailers. The dashboard delivers:
Key Metrics: Total sales of 12.01M, over 24.7M units sold, and an average operating margin of 42%.
Retailer Insights: West Soda and FlexiPro show the highest operating profits, while Amazon records steady contributions.
Regional Breakdown: Sales distributed across Midwest, Northeast, Southeast, Southwest, and Northwest, with clear growth trends in specific markets.
Brand Performance: Coca-Cola leads in total sales, followed by Dasani Water and Diet Coke, with noticeable growth across quarters.
Profitability Trends: Average gross margins vary by brand, ranging from 41% to 47%, highlighting key opportunities for optimization.
Sales Dynamics: Visualized total sales per retailer and unit pricing trends to identify revenue drivers.
This project showcases expertise in business intelligence, sales performance tracking, and extracting actionable insights from retail and brand-level data.