Sales Of Super Store From 2014 to 2017
تفاصيل العمل

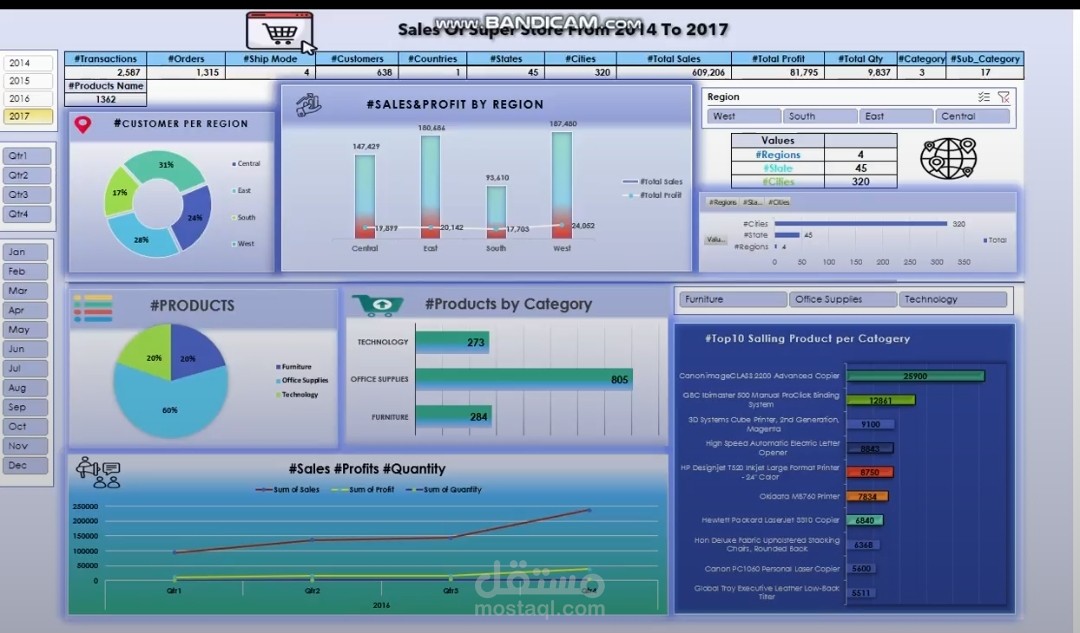
Using Pivot Tables, slicers, and multiple Chart visualizations, I turned raw sales data into an interactive dashboard showing:
Sales by product, area, and date, Regions
YTD and Monthly sales tracking
Sales & Profits & Quantity insights
Custom filters for Products by Category