Superstore Sales & Profitability Analysis Dashboard | Excel
تفاصيل العمل
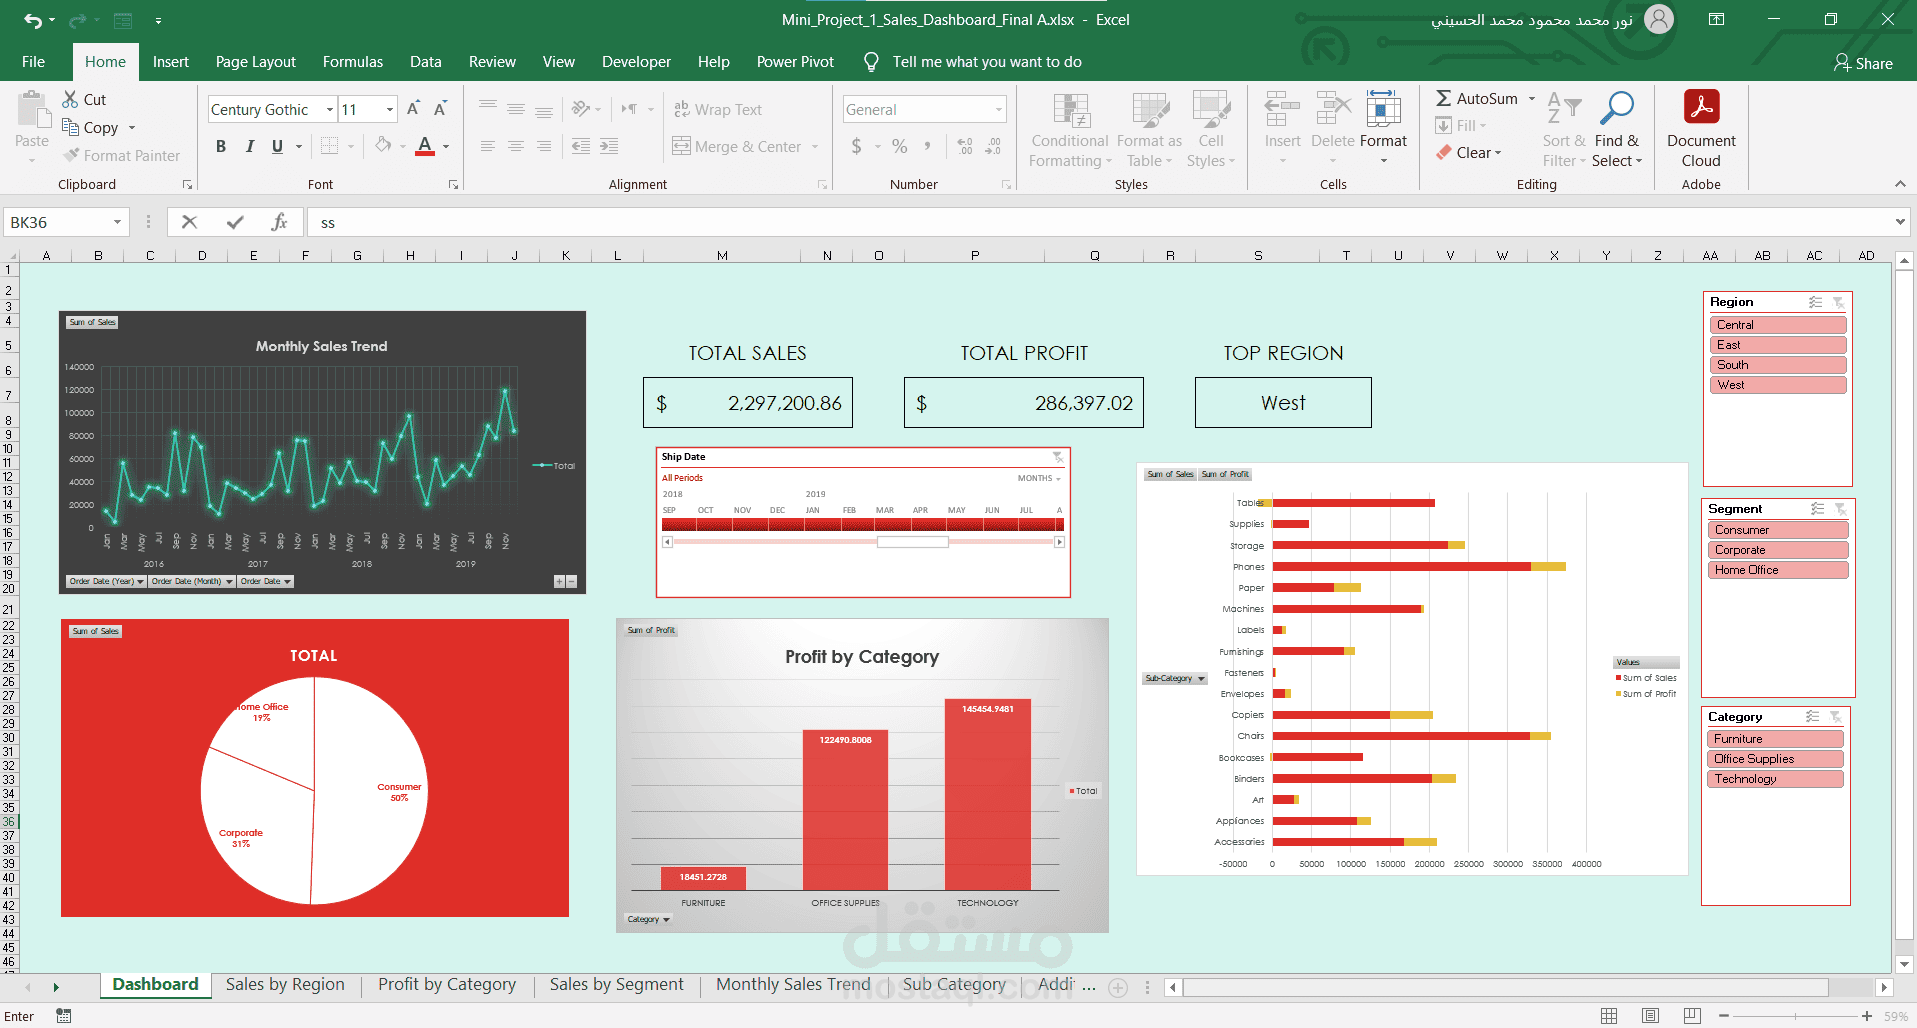
Developed an interactive Excel dashboard to analyze Superstore sales performance, profitability, and customer segments.
The project includes:
Sales Analysis: Tracking sales trends and comparing performance across regions, categories, and customer segments.
Profitability Analysis: Evaluating profit by product category and monitoring profit margins.
Returns Analysis: Analyzing returned orders to understand return patterns.
Interactive Dashboard: Using PivotTables, PivotCharts, and Slicers to enable dynamic filtering and data exploration.
Data Preparation: Cleaning and organizing data using Power Query and creating calculated columns, including Sales Category classification.
Tools Used: Microsoft Excel, Power Query, PivotTables, PivotCharts, and Slicers.
Project Goal: To transform raw sales data into an interactive dashboard that helps users explore business performance and identify useful insights for better decision-making.