Remotely
تفاصيل العمل
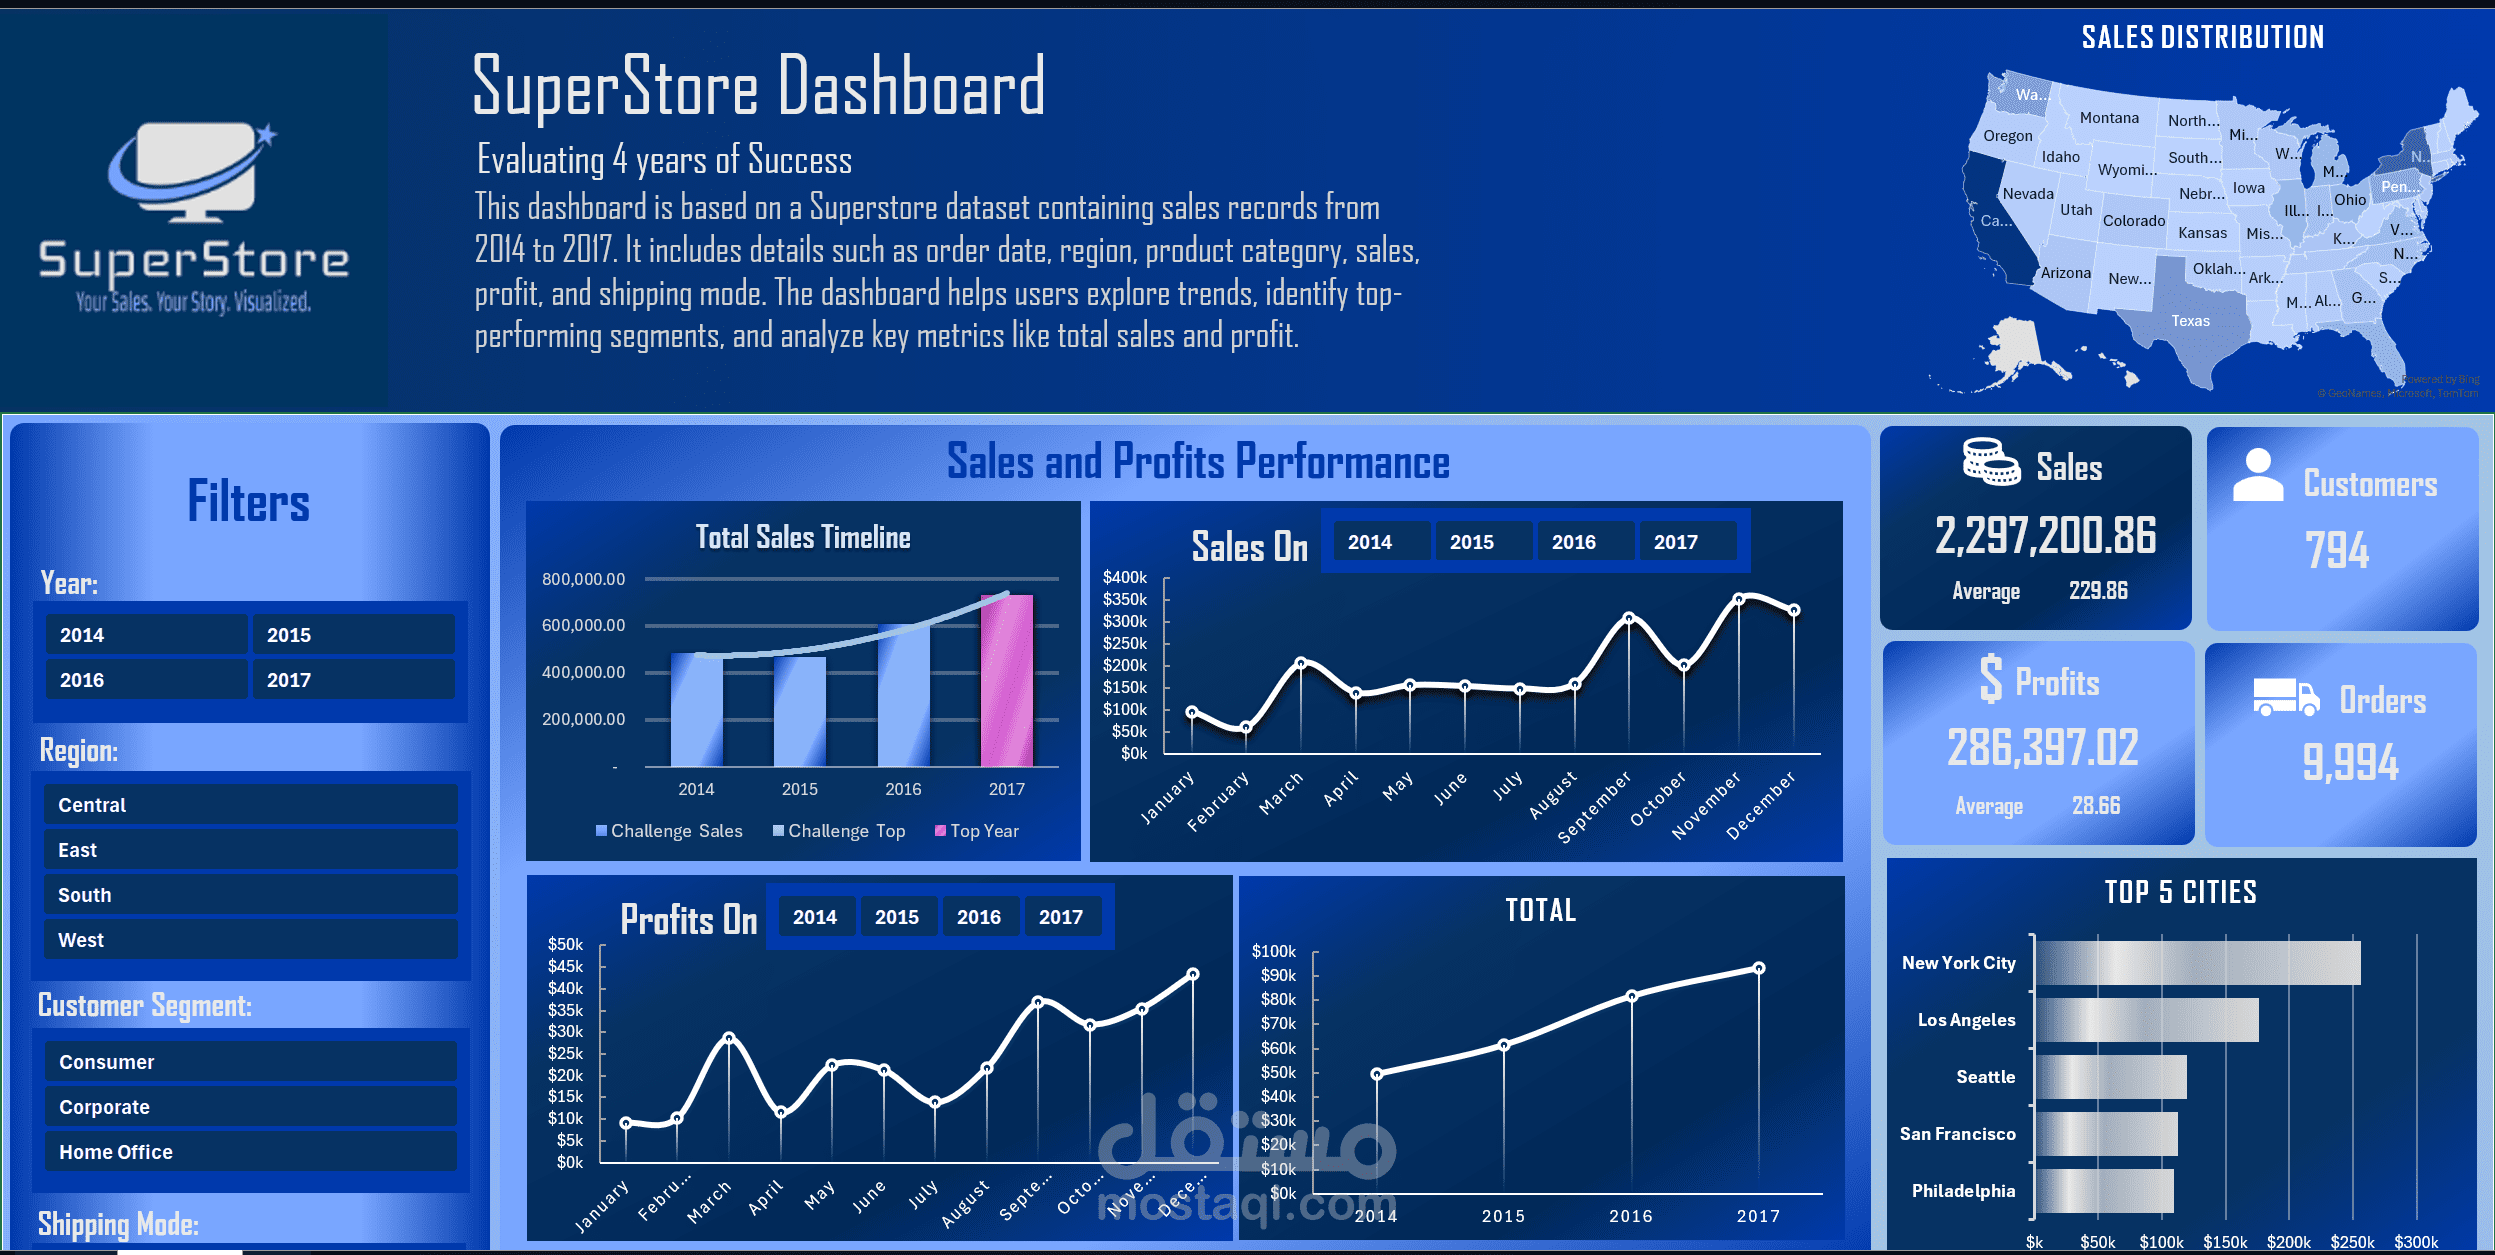
This Excel dashboard provides a comprehensive analysis of an online store’s dataset, covering key aspects such as sales, profit, customers, shipping modes, regions, and more. It features interactive filters for years, customers, and regions, allowing users to explore the data from multiple perspectives. The dashboard delivers clear, actionable insights through well-structured visualizations, making it easier to track performance, identify trends, and support data-driven decisions.