excel dasboard
تفاصيل العمل
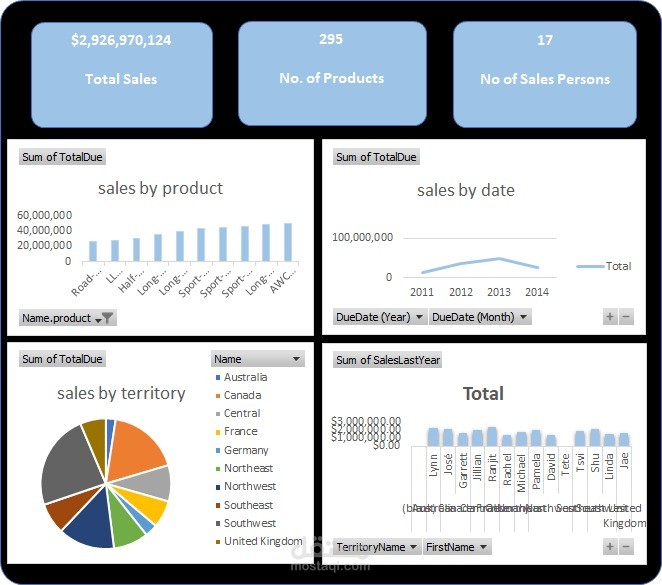
Overall, the dashboard provides a quick view of total revenue, product count, sales staff, and sales distribution across products, time periods, regions, and individuals. The process involved retrieving raw data from the server, cleaning it, transforming it in Power Query, and building the visuals for analysis in Excel.