"Sales and Orders Data Analysis Dashboard"
تفاصيل العمل
Project 1 – Sales and Orders Data Analysis
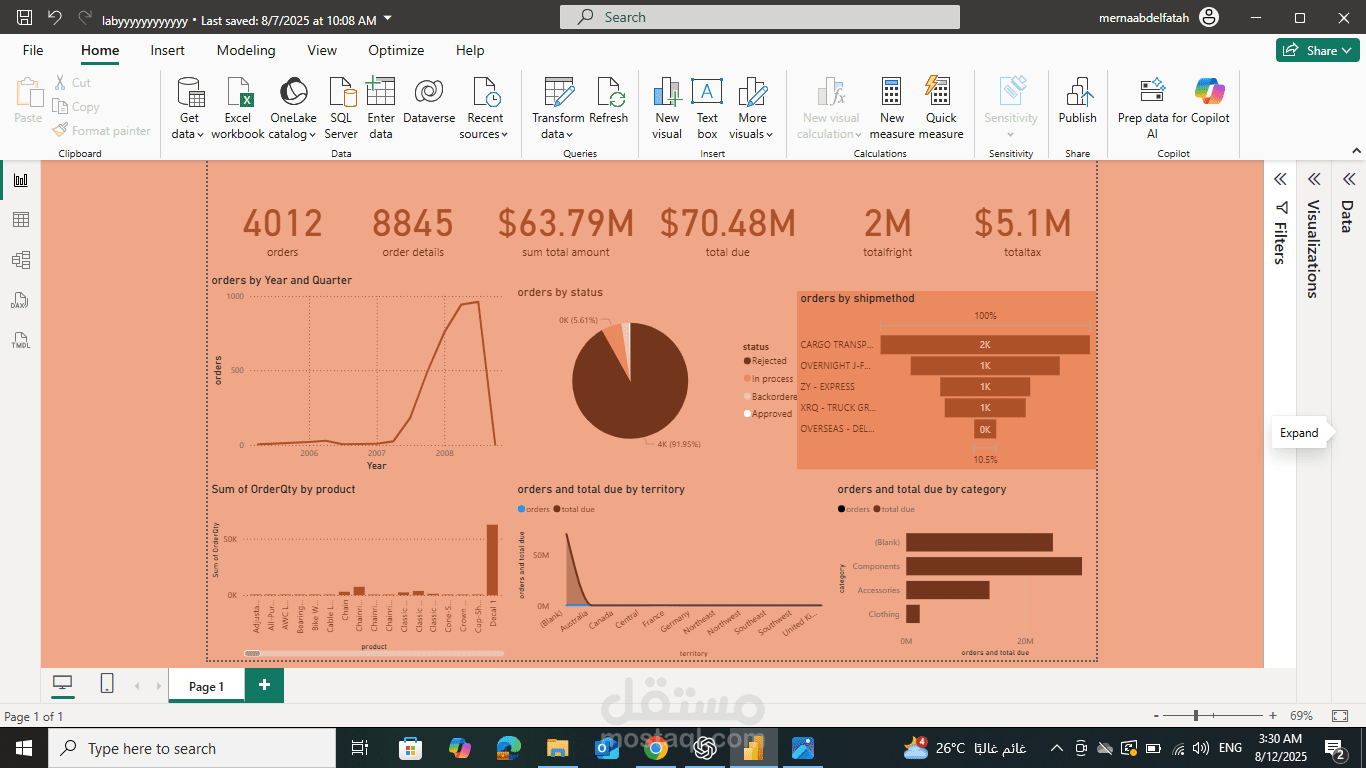
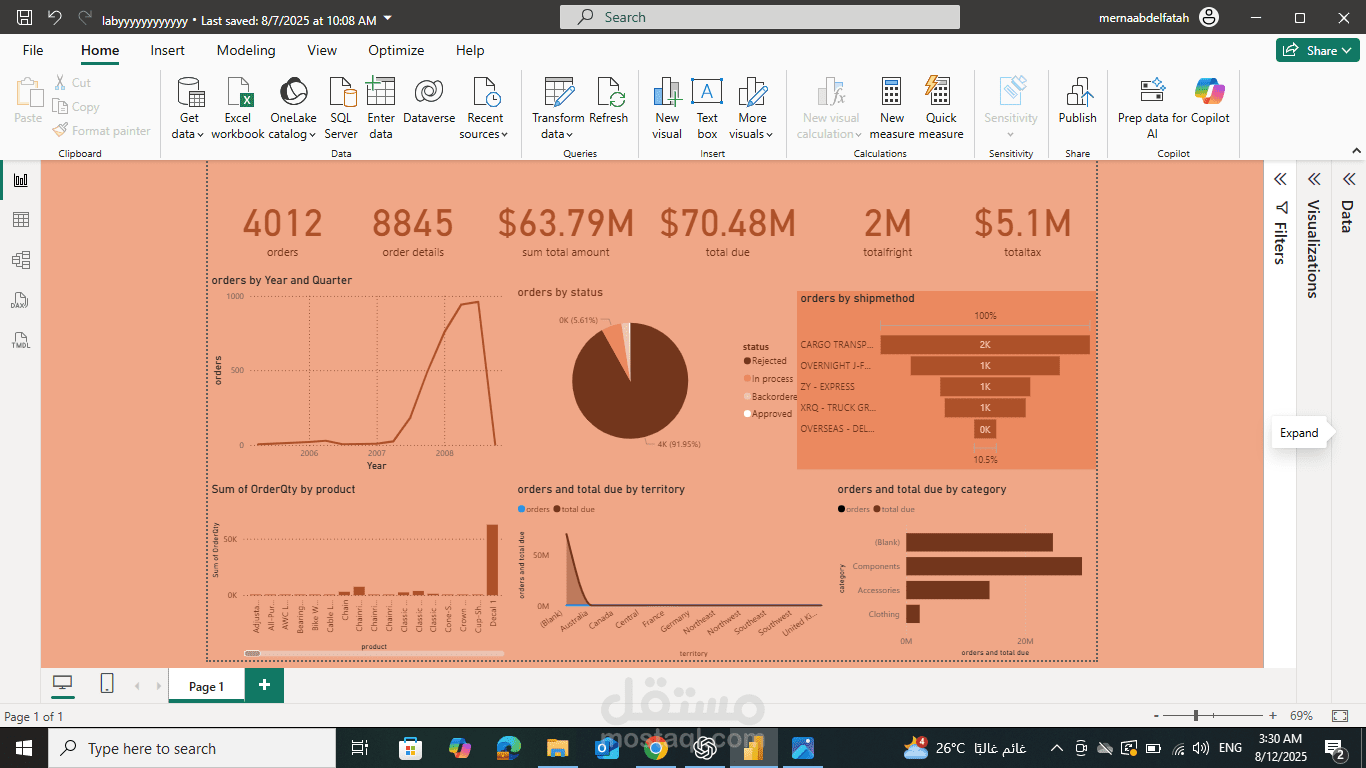
In this project, I designed an interactive Power BI dashboard to visualize and analyze sales and orders data.
The dashboard included:
KPIs showing total orders, order details, total amount, and outstanding balance.
Order status breakdown (active, completed, canceled) using pie charts.
Sales analysis by product and by geographical territory.
Time-series trends showing order volume over different periods.
A hierarchical bar chart highlighting top customers or cities by order volume.
This project provided a clear view of overall performance, helped identify high-value regions and customers, and improved decision-making through interactive filtering and data exploration.