Analyzing coffee sales data using Excel , Dashboard
تفاصيل العمل
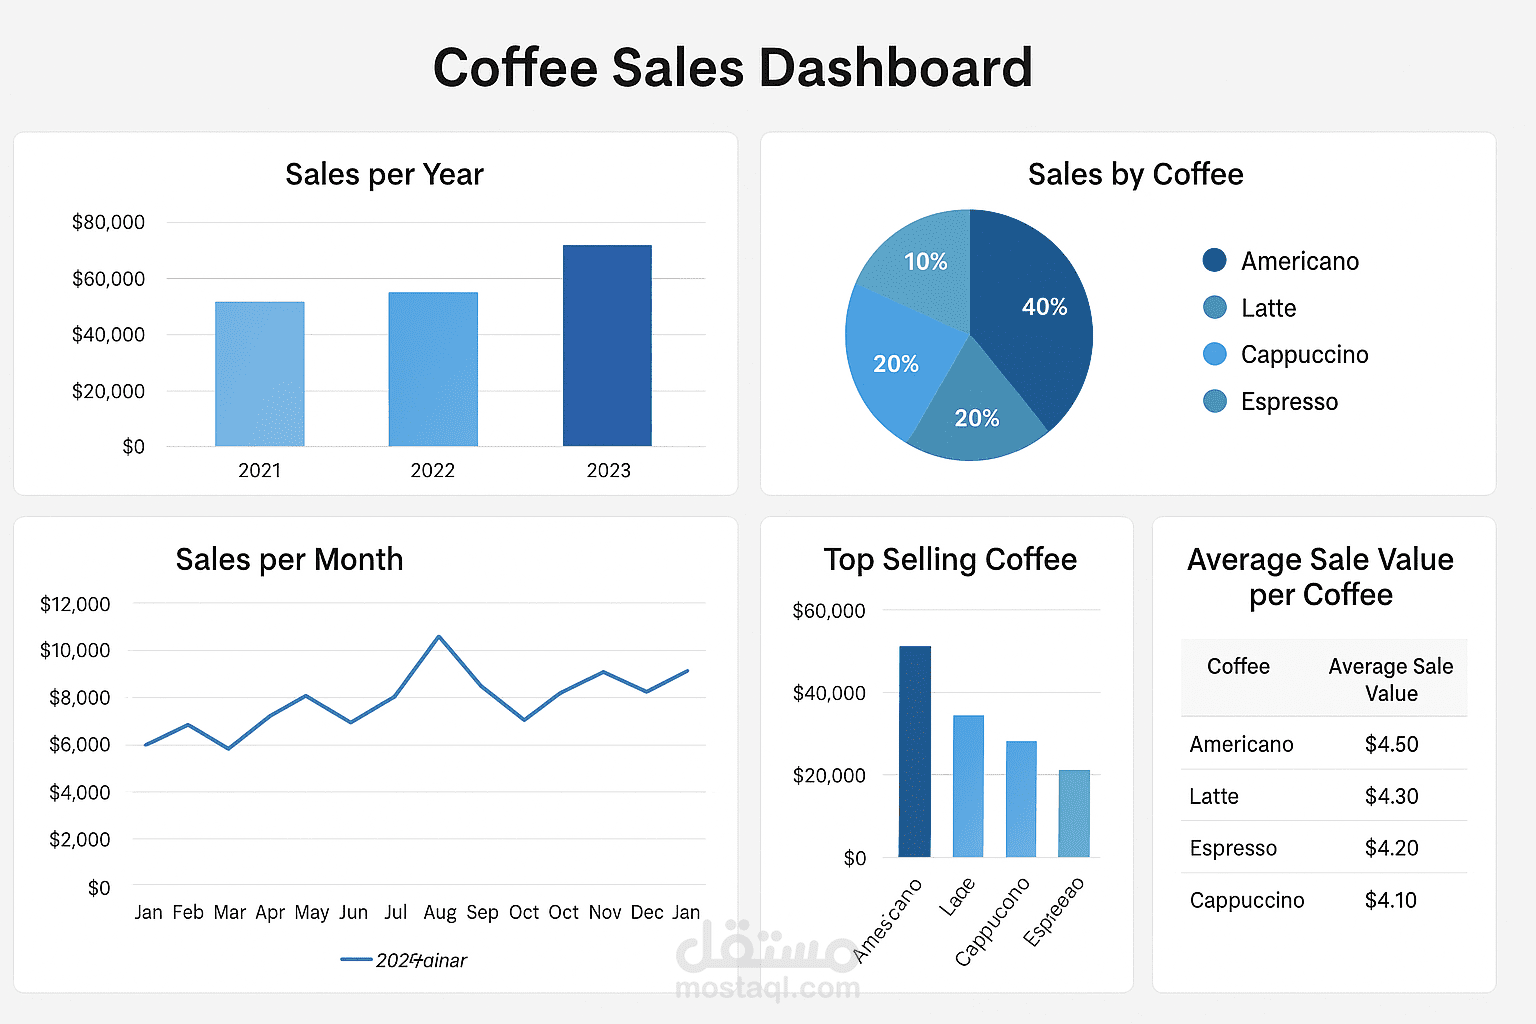
Analyzing coffee sales data using Excel , Dashboard
> Loading data...
- Columns: Year, Date, Cash Type, Money, Coffee Name
> Cleaning & organizing data... [DONE]
> Calculating KPIs...
• Total Sales
• Total Quantity Sold
• Sales per Year
• Sales per Month
• Top 10 Best-Selling Products
• Sales % by Payment Type
> Creating visualizations...
• Bar Charts -> Yearly & Monthly Sales Trends
• Pie Chart -> Payment Method Distribution
• Table -> Top Products
> Formatting dashboard for clarity & usability... [DONE]
$ tools --used "Microsoft Excel (Power Query, Pivot Tables, Charts)"
$ status "Project Completed "