Airlines Flights Data Analysis
تفاصيل العمل
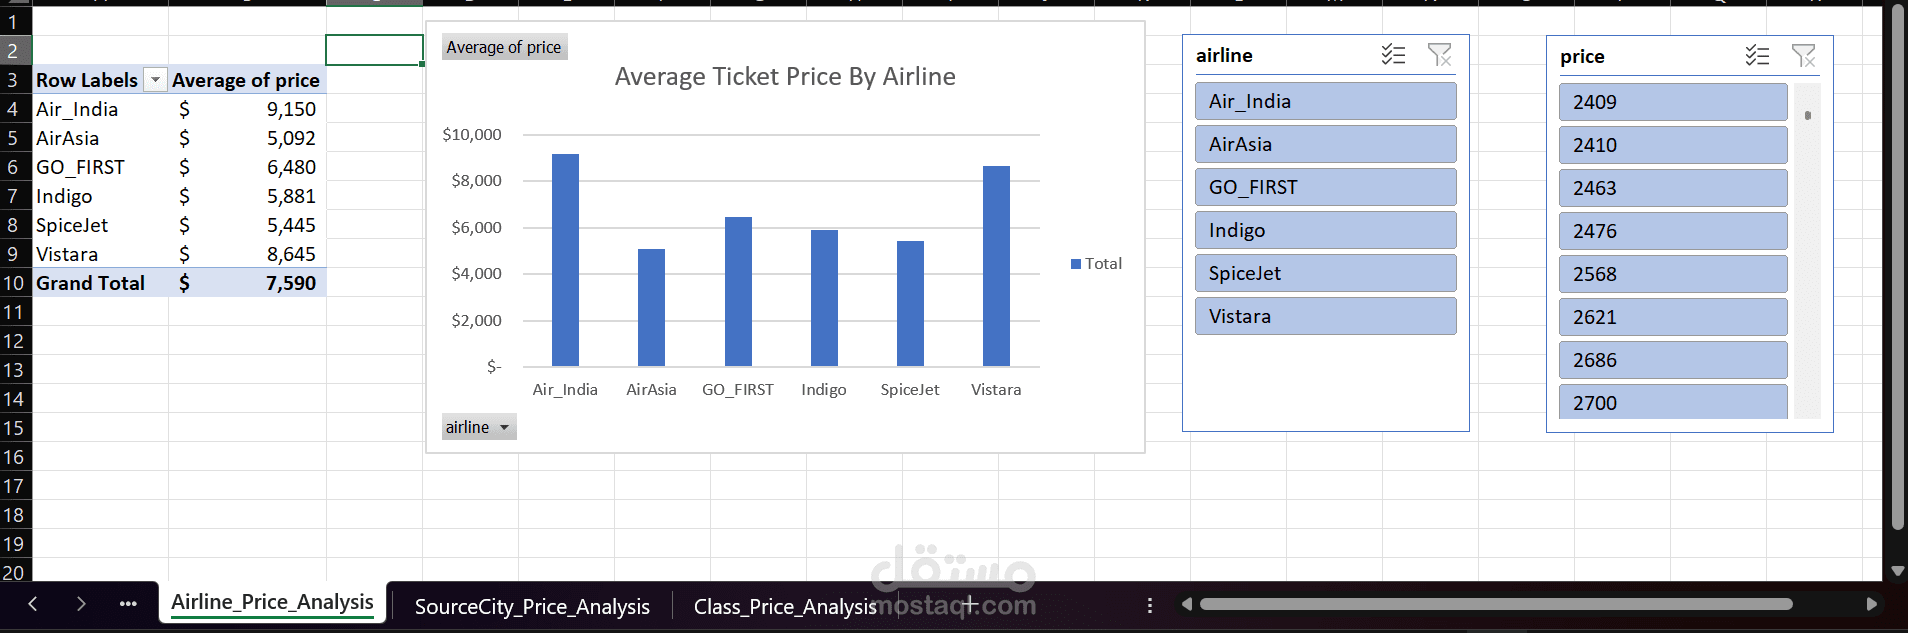
I cleaned and organized a dataset of around 5,000 airline flight records. Using Excel Pivot Tables and Slicers, I created an interactive dashboard to explore the data.
The analysis includes filtering by airline, source and destination cities, stops, and travel class, as well as summarizing prices and calculating averages.
The file is fully editable and can be customized or expanded based on client requirements.
This project showcases strong data analysis skills in Excel, making it easier for businesses to make informed decisions from raw flight data
Clean Data – Removed duplicates, organized columns, and formatted data for analysis.
Interactive Dashboard – Built with Pivot Tables and Slicers for quick filtering and insights.
Actionable Insights – Summarized key metrics like average prices, flight duration, and route patterns