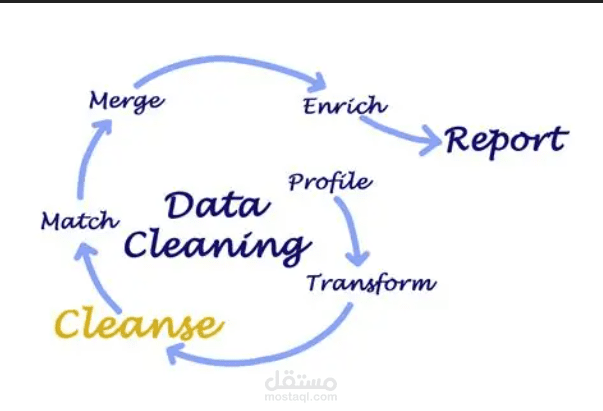
Data Cleaning using excel power query
تفاصيل العمل
As part of my data analysis workflow, I performed a full cleaning and transformation process on a raw e-commerce order dataset. Here's a summary of what was done:
Before Cleaning (Raw Data):
Rows: 816
Columns: 8
Missing contextual information (e.g., customer names, profit, duration)
Redundant or non-descriptive columns
No derived KPIs or business metrics
After Cleaning & Transformation:
Rows reduced to 799 (after removing duplicates or invalid records)
Columns expanded to 11 for better analysis
Added derived columns:
Customer Name for better identification
Profit = Revenue - Cost
Duration = Days between Order Date and Ship Date
Ensured all missing values were handled (0 nulls)
Improved column naming consistency (e.g., renaming "Customer ID" to avoid confusion)
Tools Used:
Microsoft Excel
Power Query (if applicable)
Data cleaning logic (formulas, filtering, derived metrics)
This process helped prepare the data for further visualization and decision-making, like the Power BI
