Academic and Financial Dashboard for Educational Institution – Zewail City
تفاصيل العمل
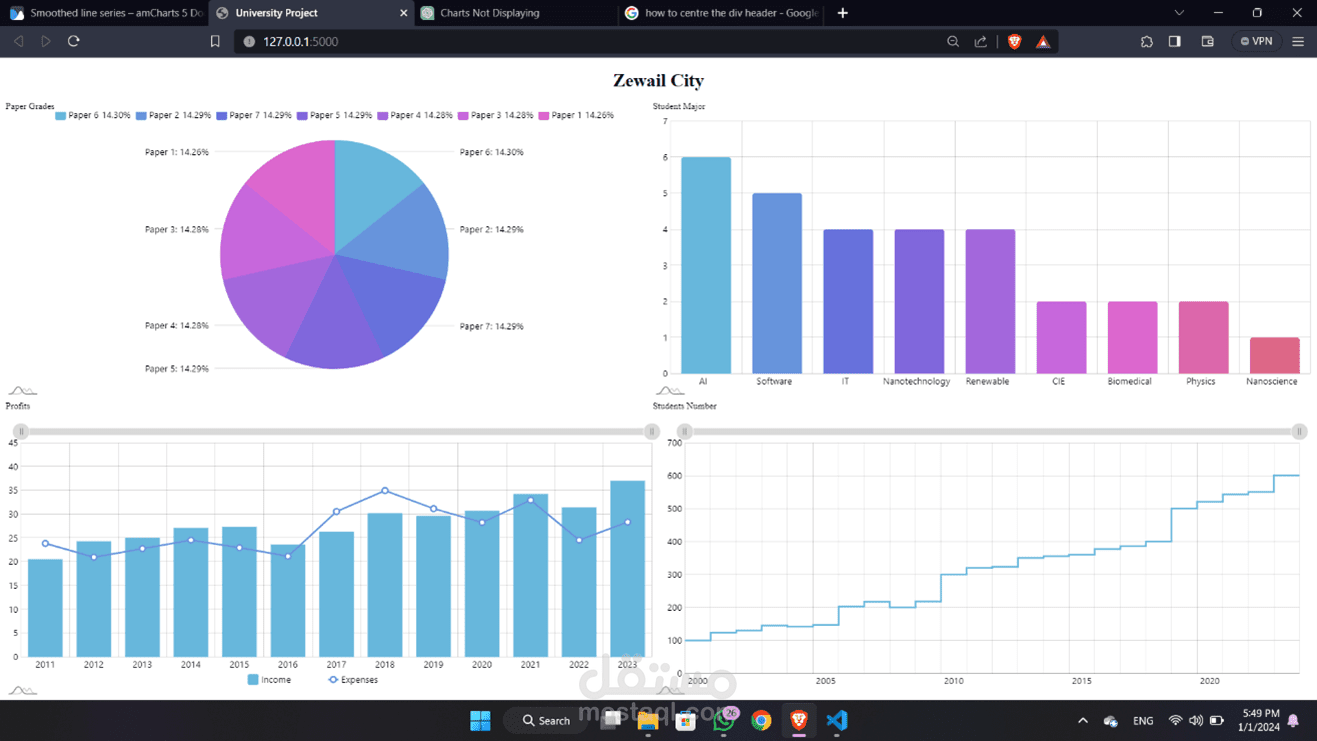
This dashboard was designed as a university project for Zewail City, displaying academic and financial insights using interactive charts.
The dashboard includes:
Pie chart showing paper grading distribution
Bar chart for student major statistics
Line chart comparing annual income and expenses
Step chart tracking student enrollment over the years (2000–2023)
The dashboard provides a comprehensive view of student data and financial trends