Advanced Stock & Consumption Dashboard – Power BI
تفاصيل العمل
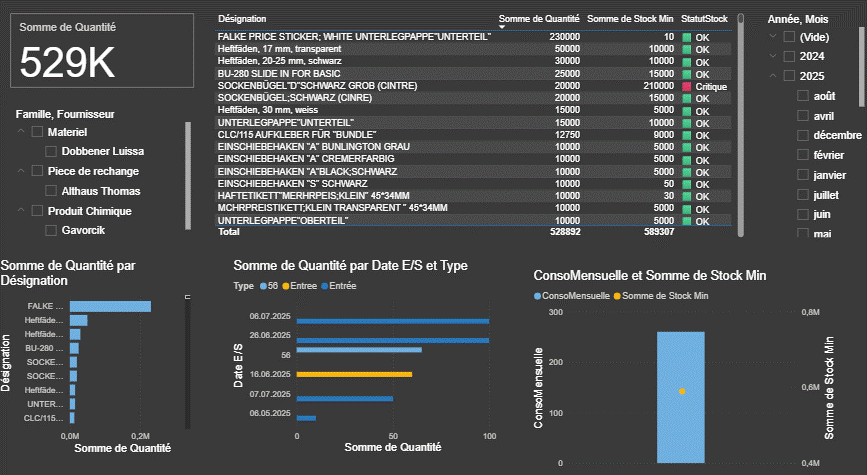
I designed and implemented a fully interactive stock management and consumption monitoring dashboard in Microsoft Power BI, integrating multiple data sources to provide real-time insights and KPIs for decision-making.
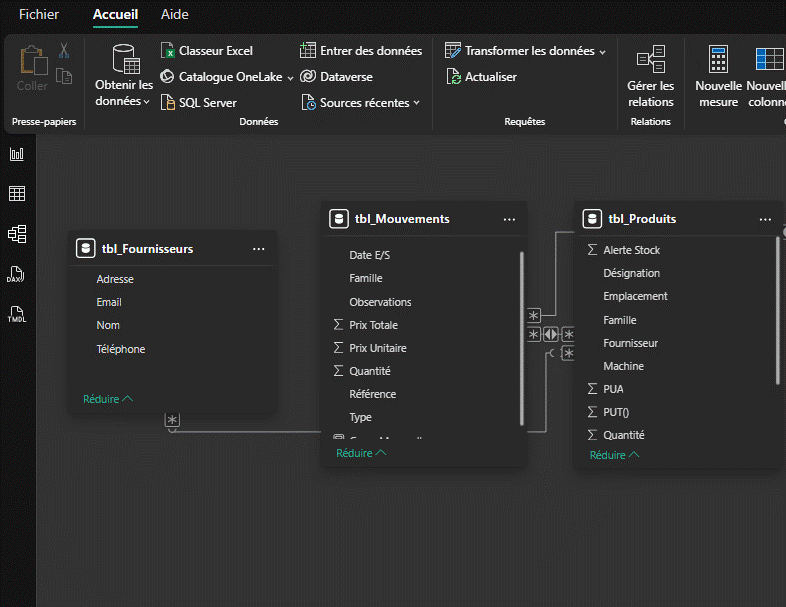
The system connects three main datasets:
Products table – product references, names, categories, stock levels, thresholds, suppliers
Suppliers table – supplier contact information and product mapping
Movements table – stock entries, exits, dates, quantities, unit prices
Main Features & Deliverables:
Interactive dashboard with dynamic charts, KPIs, and filters (slicers)
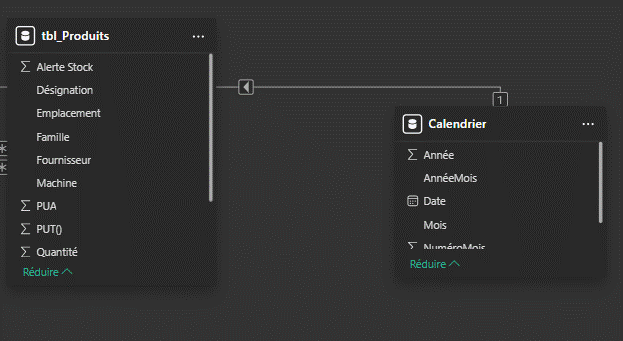
Automatic data relationships between products, suppliers, and stock movements
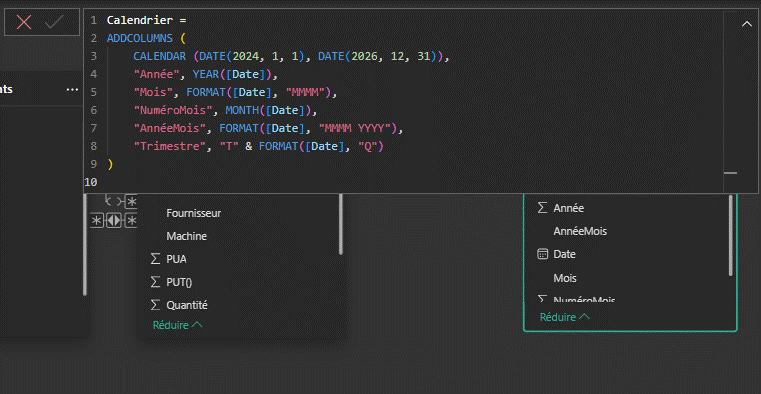
Date table for monthly, quarterly, and yearly analysis
KPI Cards:
Total stock quantity & value
Number of critical stock products (stock ≤ threshold)
Monthly consumption trends
Visual analytics:
Column & line combo chart comparing monthly consumption vs stock threshold
Top 5 most consumed products
Supplier contribution analysis
Pie chart of stock status (OK / Alert / Critical)
Custom DAX measures for:
Monthly consumption (only product exits)
Dynamic average threshold
Stock status classification
User-friendly filters: by product, supplier, family, and time period
Professional formatting with color-coded statuses and visual indicators
Objective:
Provide managers and stakeholders with a clear, interactive, and visually appealing dashboard that tracks product consumption, detects low stock levels, and helps in planning replenishments efficiently.
Tools & Technologies:
Microsoft Power BI Desktop
DAX (Data Analysis Expressions)
Excel (data preparation)
Data modeling & relationships
The final dashboard significantly reduced the time needed to analyze stock and consumption trends, allowed real-time monitoring of thresholds, and improved decision-making for procurement and stock management.


