inventory management application
تفاصيل العمل
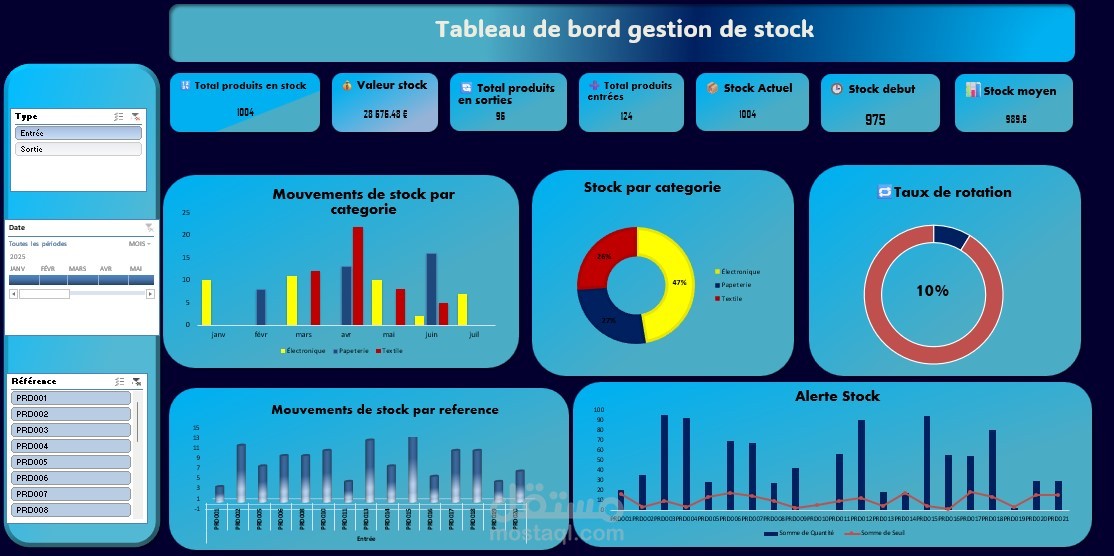

This project is a complete inventory management solution developed in Excel with VBA automation and advanced formulas to manage stock movements, track key performance indicators (KPIs), and generate dynamic reports.
Key Features:
Automated Stock Movements:
A custom VBA UserForm allows quick and accurate registration of stock entries and exits, including date, category, reference, quantity, and unit price.
Automatic KPI Calculations:
The dashboard instantly updates to show essential indicators such as:
Total products in stock
Stock value (€)
Turnover rate
Opening stock and average stock levels
Category & Reference Analysis:
Movements are analyzed by category and product reference using Pivot Tables, enabling better decision-making and stock optimization.
Stock Alerts:
A macro automatically checks stock levels against predefined thresholds and issues alerts to prevent shortages.
Interactive Dashboard:
Visually appealing and easy to navigate, displaying:
Monthly stock movements by category
Stock distribution by category (pie chart)
Turnover rate (doughnut chart)
Low stock alerts
Detailed charts of movements by reference
Tools & Techniques Used:
Excel (advanced formulas, Pivot Tables, conditional formatting)
VBA (UserForms, macros for alerts, automated updates)
Data visualization with custom-designed charts and KPI indicators
A professional, automated dashboard that helps businesses monitor inventory in real time, reduce stockouts, and improve stock rotation, all within the familiar Excel environment.