Analyze FMCG Sales Data & Dashboard Creation Using Excel
تفاصيل العمل
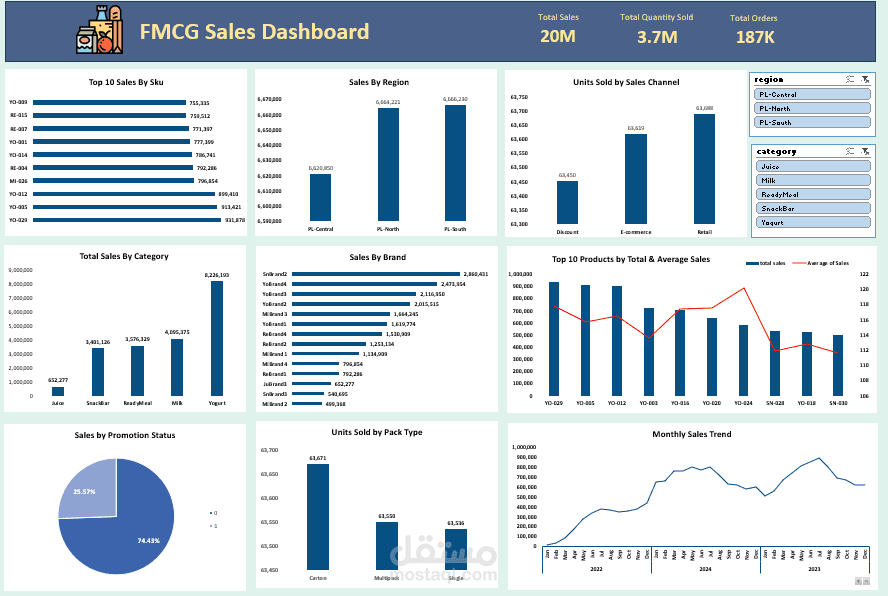
Project: FMCG Sales Data Analysis & Dashboard (2022–2024)
Tools: Microsoft Excel – Pivot Tables, Power Query, Charts
Cleaned and prepared raw sales data (190K+ rows)
Added calculated fields:
→ Sales = Price per Unit × Units Sold
→ Order Count = IF(Units Sold > 0, then 1)
Built pivot tables for:
→ Sales by Date, Month, Brand, Region, Channel, Category
→ Units Sold by Pack Type
→ Promotion vs Non-Promotion Analysis
→ Top 10 SKUs by Total & Average Sales
Created interactive dashboard with:
→ Combo box toggle (Total vs Avg Sales)
→ Dynamic charts with proper labels & formatting
Ensured responsive, easy-to-read design
Outcome: Professional sales dashboard ready for reporting or business insights