Supermarket Sales Dashboard
تفاصيل العمل
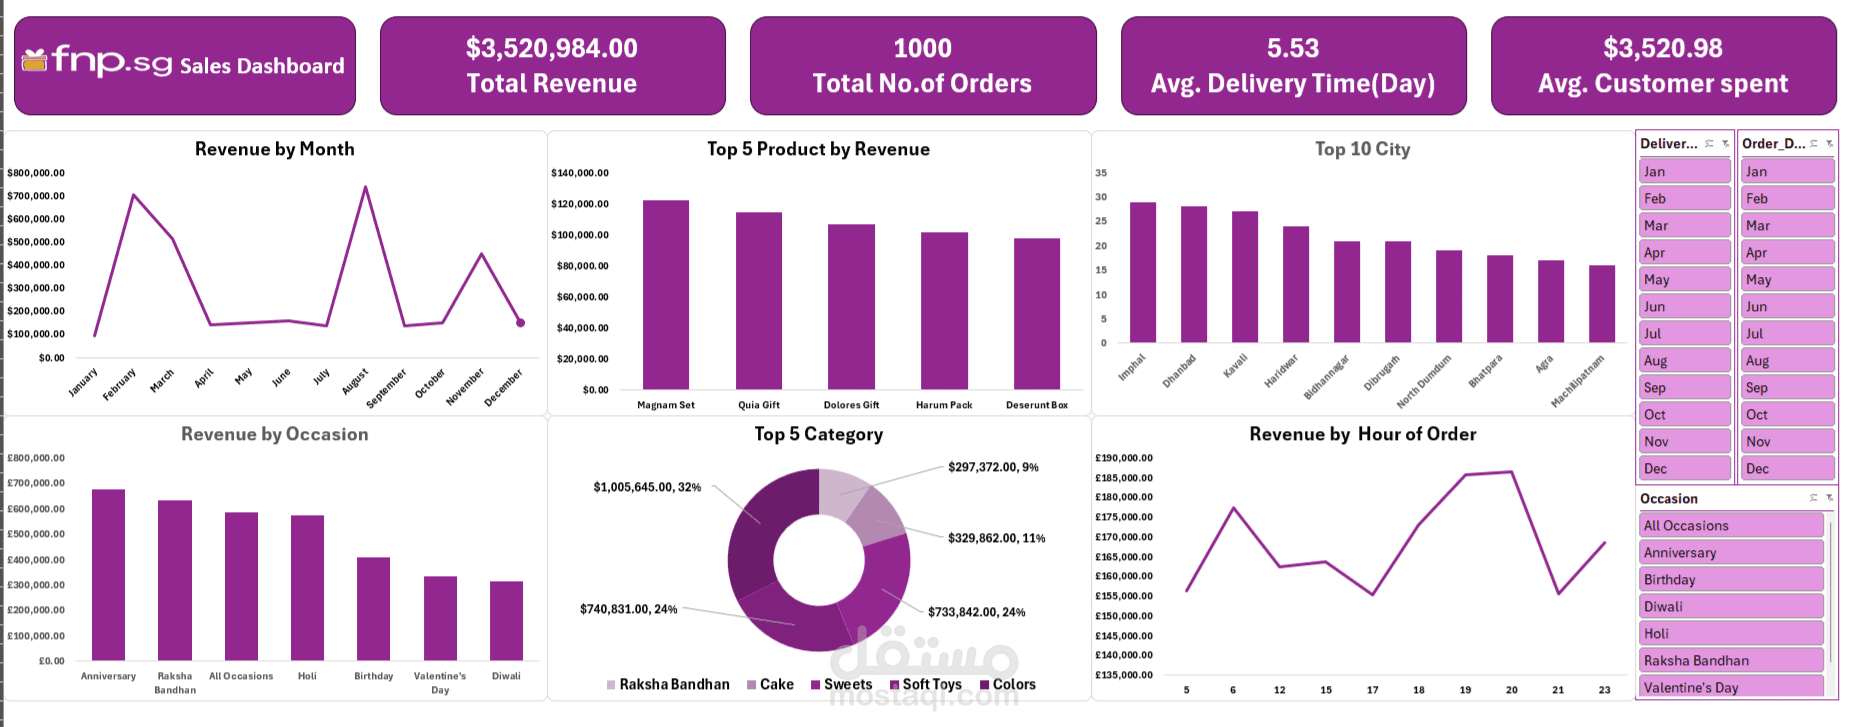
Supermarket Sales Dashboard
Skilled in interpreting sales dashboards to drive business insights. Proficient in data visualization, trend analysis, and performance reporting.
Key Skills:
- Dashboard Analysis: Analyze key metrics like total revenue, number of orders, and average customer spend.
- Trend Identification: Pinpoint monthly, hourly, and seasonal sales trends (e.g., peak revenue during "Raksha Bandhan" and other occasions).
- Performance Monitoring: Evaluate top-performing products, categories, and cities.
- Data Visualization: Expertise in creating clear and actionable reports using BI tools (e.g., Power BI, Excel).
- Strategic Recommendations: Translate data into business strategies for marketing, inventory, and operations.
Results of Key insights from the dashboard:
- Total Sales: $3,520,984.00 from 1,000 orders.
- Top Occasions: Raksha Bandhan is the highest revenue driver, followed by Birthday and Anniversary.
- Key Trends: Revenue fluctuates monthly, with a peak around October. Orders are concentrated during specific hours of the day.
- Top Performers: A specific city is the top sales location. One product and one category stand out as the highest revenue earners.
- Operations: Average delivery time is 5.53 days.