Attrition Dashboard
تفاصيل العمل
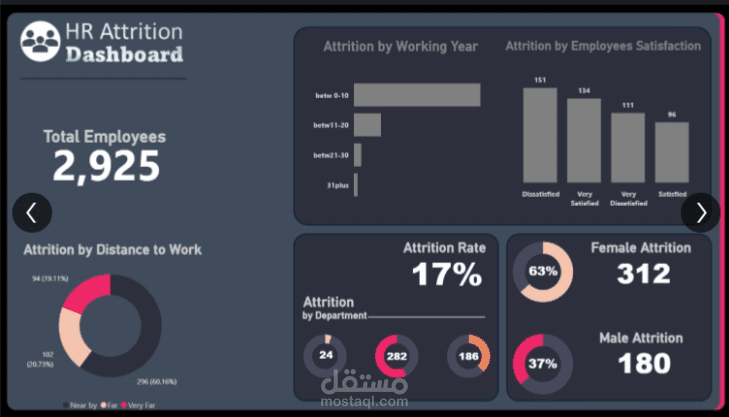
HR Attrition Analysis Dashboard | Power BI Project
Just completed my first Power BI dashboard analyzing HR attrition for 2,925 employees! From raw data to actionable insights, here’s how I tackled it:
Process Snapshot
1. Cleaned Data: Fixed inconsistencies (e.g., satisfaction categories, attrition labels).
2. Modeled Metrics: Calculated 17% attrition rate, gender gaps, and department trends.
3. Visualized Insights: Built interactive charts to spotlight turnover drivers.
Key Findings
- High Female Attrition: 312 women left vs. 180 men.
- R&D Crisis: 63% of all attrition came from R&D (232 exits).
- Satisfaction Paradox: 71% of departing employees were "Satisfied" or higher.
- Tenure Trend: Junior staff (0–10 years) were most likely to leave.
Why It Matters
The dashboard reveals where HR should focus retention efforts—especially for women, R&D teams, and early-career talent. Surprising insight: Attrition isn’t always about dissatisfaction!