Analyze Supplement Sales Data & Dashboard Creation Using Excel
تفاصيل العمل
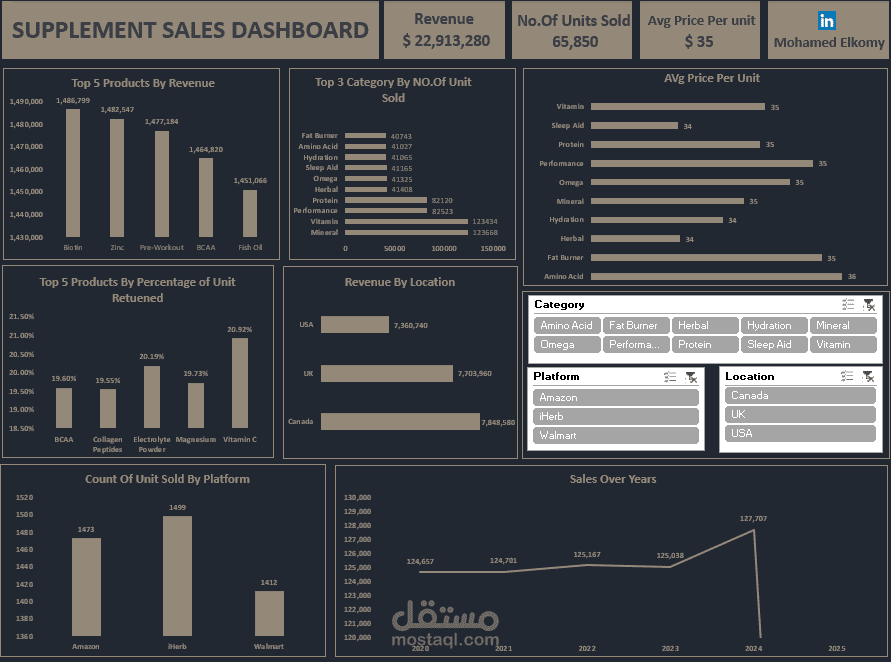
I worked on a supplement sales dataset
containing fields like date, product name, category, units sold, price, revenue, discount, units returned, platform, and location.
First, I used Power Query to clean the data
and added a new calculated column for "Returned Rate"
to help identify high-return products and improve insight quality.
Then, I used Pivot Tables to perform several key analyses:
- Total Revenue
- Sum of Units Sold
- Average Price per Unit
- Top 5 Products by Revenue
- Units Sold by Category
- Average Price per Unit by Category
- Top 5 Products by Units Returned
- Revenue by Location
- Units Sold by Platform
- Sales Trend by Year
After completing the analysis,
I designed an interactive Excel Dashboard
that includes slicers for filtering by Year, Category, Platform, and Location.
All work was done using Microsoft Excel,
including Power Query for data transformation,
Pivot Tables for summarization,
and a professional dashboard to display insights clearly.