Bike Analysis
تفاصيل العمل
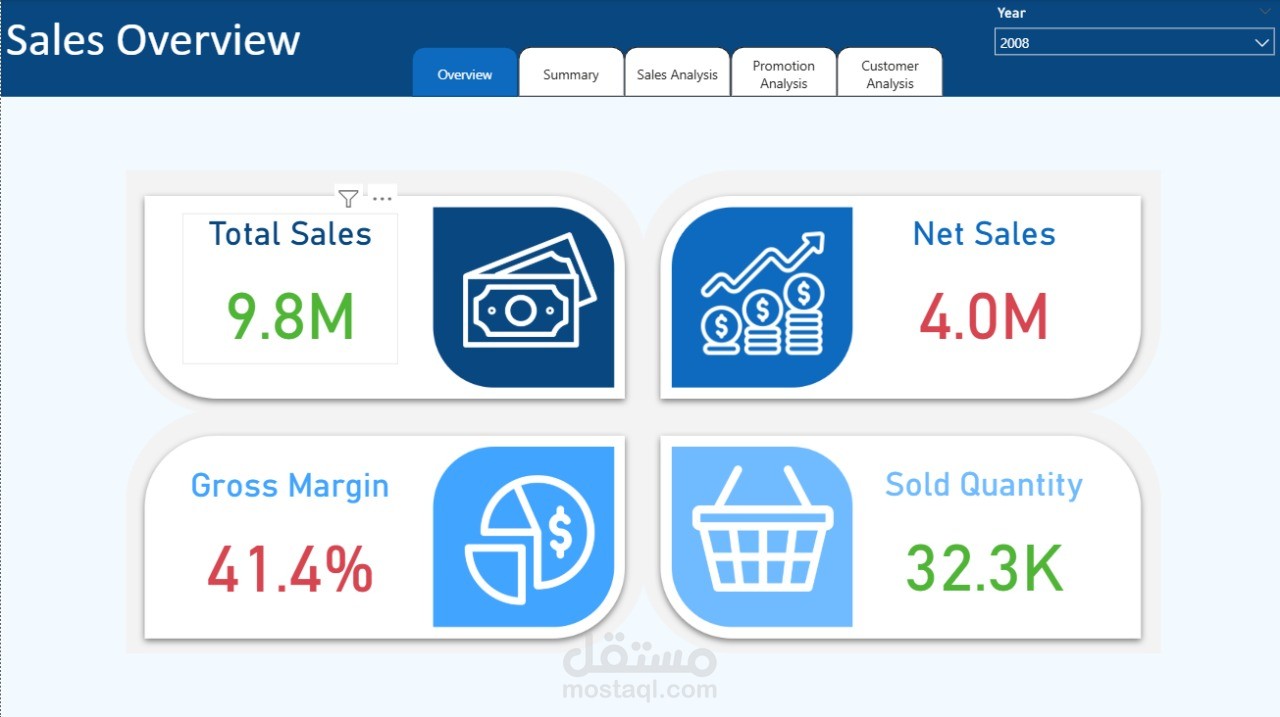
This project helped me transform raw sales data into valuable insights using relationships, calculated KPIs, and interactive visualizations — all designed to support smarter business decisions.
---
Project Tables & KPIs:
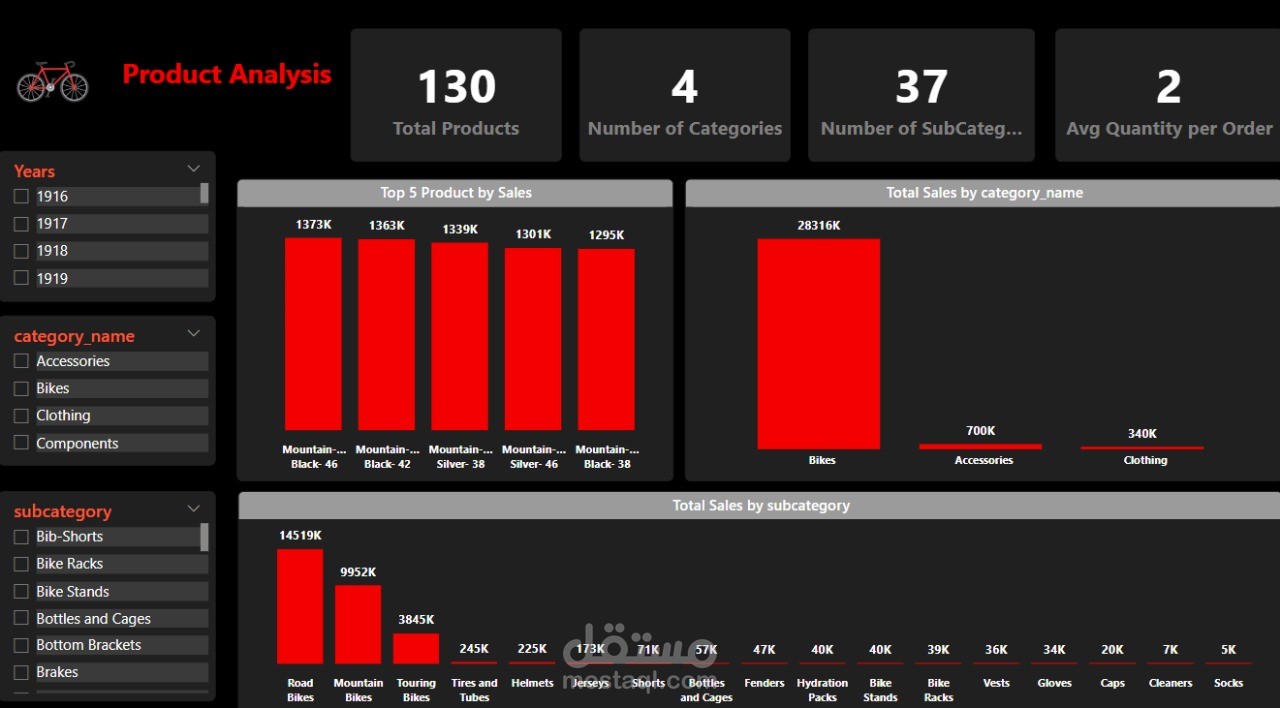
1️⃣ **Products Table**
Includes: `Product ID`, `Product Name`, `Product Category`, `Unit Price`
**KPIs Extracted:**
* Total number of products
* Number of categories
* Average unit price
* Most and least expensive products
**What I did:**
* Built visual breakdowns by product and category
* Linked product info to sales data for revenue and performance analysis
---
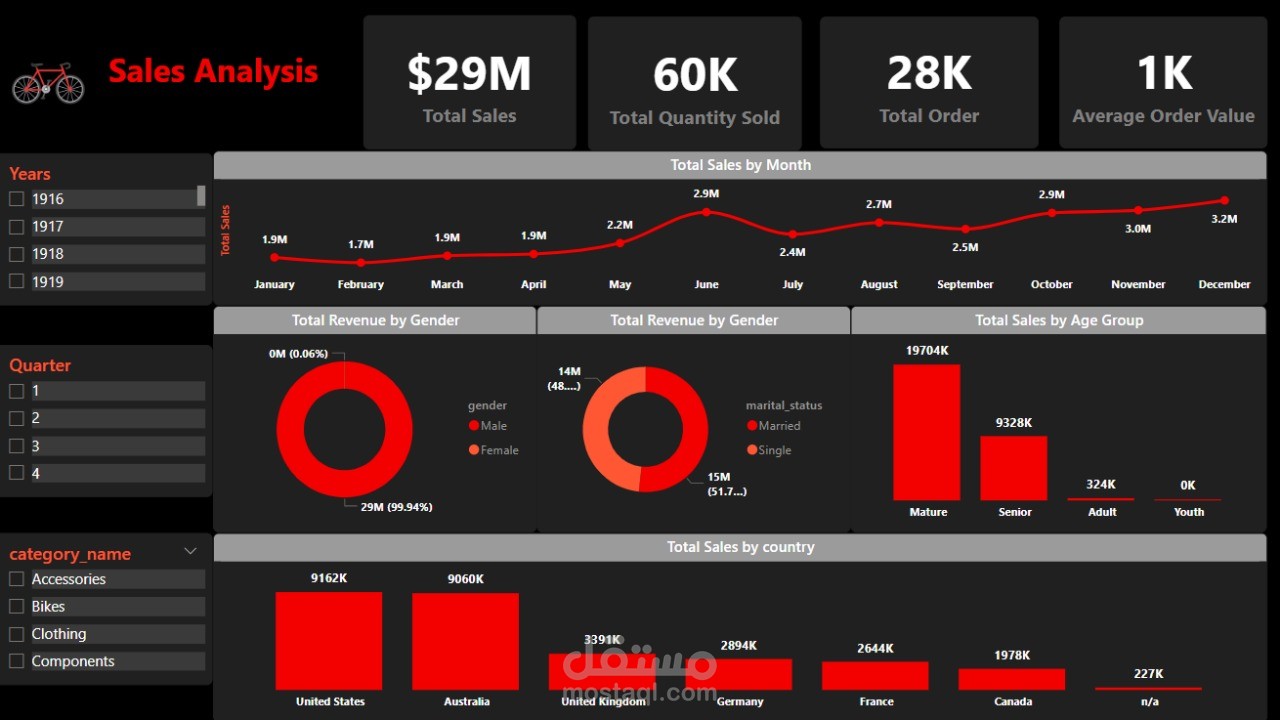
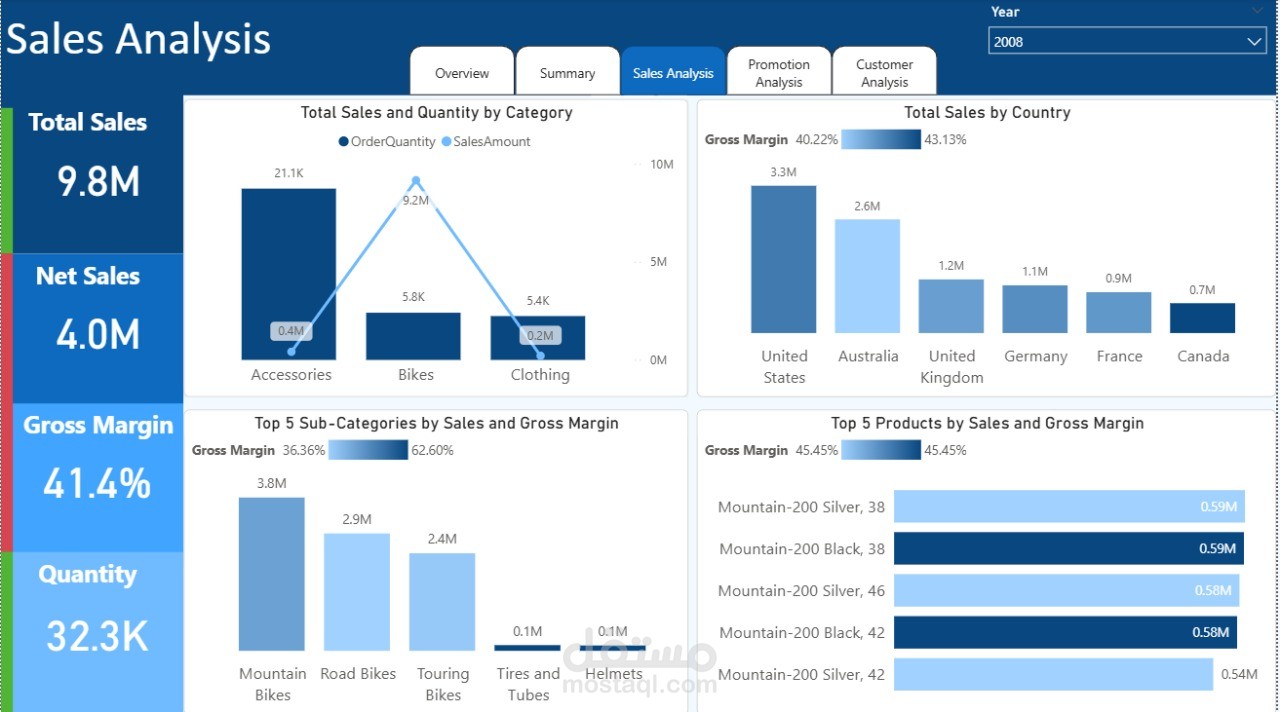
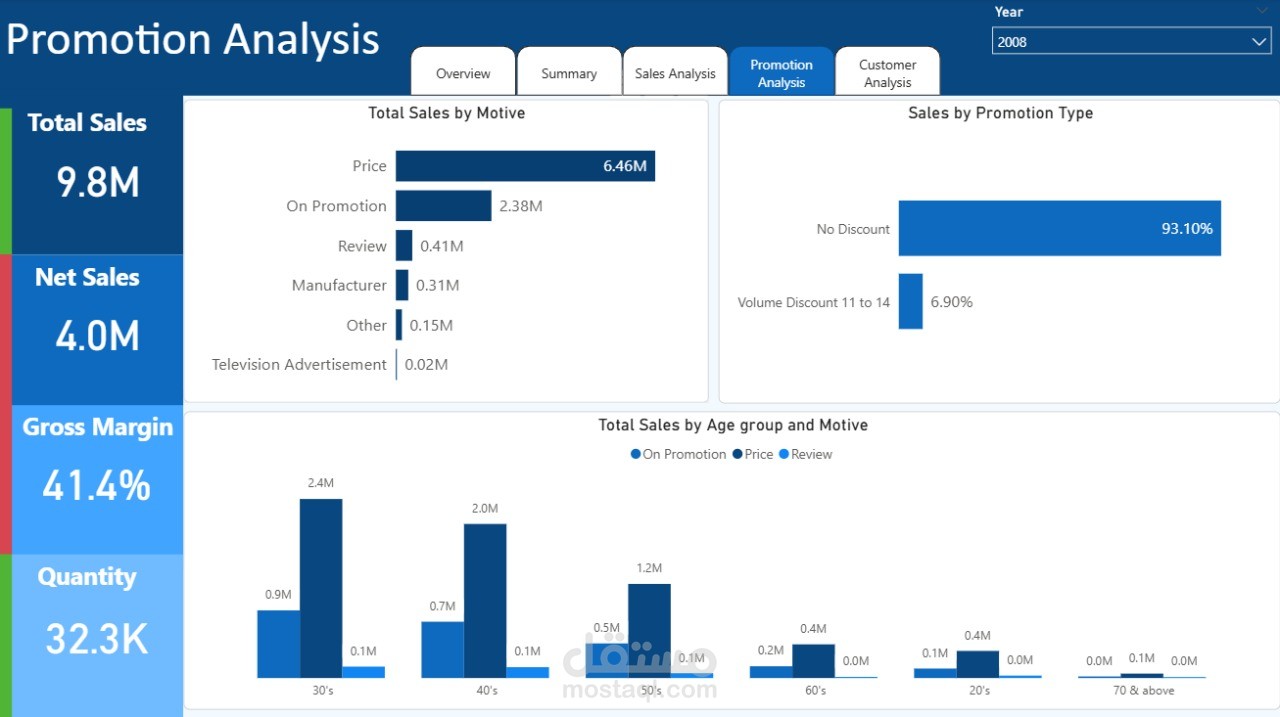
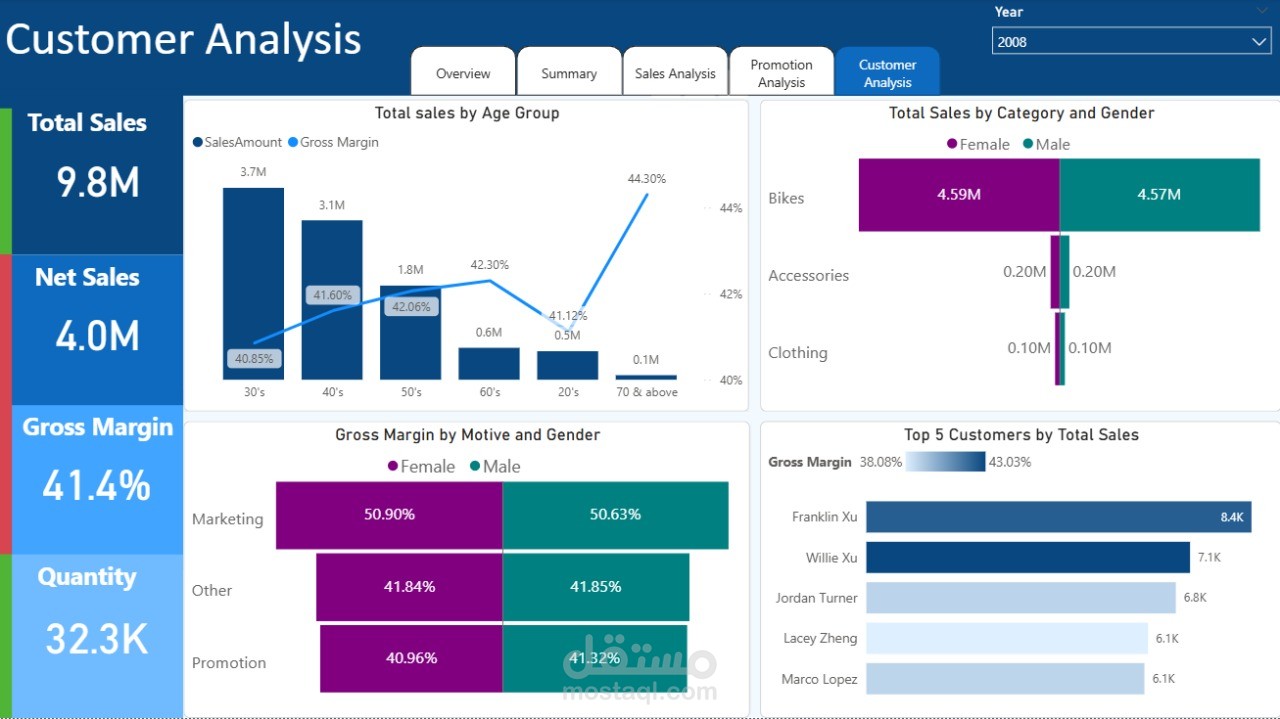
2️⃣ **Sales Table**
Includes: `Product ID`, `Units Sold`, `Total Sales`, `Date`, `Store Name`, `Region`
**KPIs Extracted:**
* Total sales (SUM)
* Total units sold
* Average revenue per product
* Monthly and yearly sales trends
* Top and bottom performing stores and regions
**What I did:**
* Created DAX measures for dynamic KPIs
* Designed charts (bar, line, matrix) to display performance across regions, time, and product categories
---
3️⃣ **Date Table**
Used to analyze time-based trends
**KPIs Extracted:**
* Sales by year, month, and quarter
* Seasonal performance patterns
**What I did:**
* Built a time hierarchy
* Enabled users to filter and analyze sales over custom date ranges
---
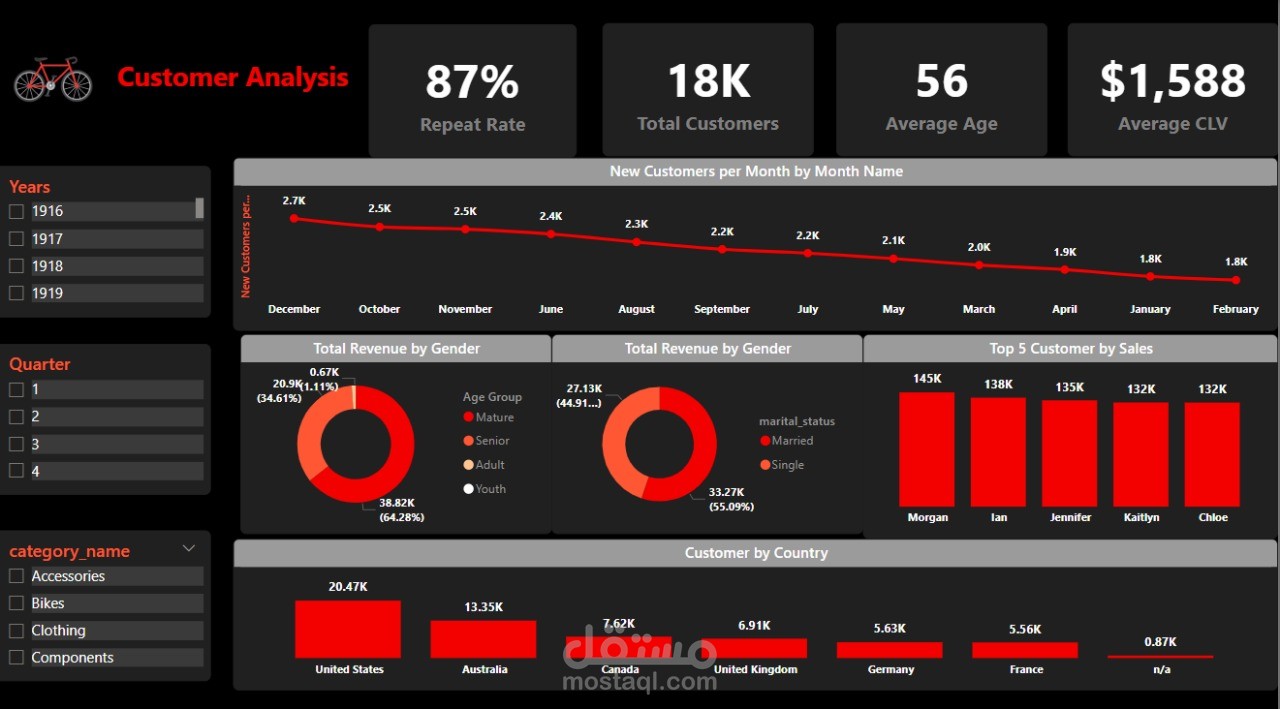
4️⃣ **Store/Region Breakdown**
Includes: `Store Name`, `Region`
**KPIs Extracted:**
* Number of stores
* Regional sales contributions
* Store-level performance comparison
**What I did:**
* Used slicers and donut charts to compare regions
* Analyzed store-level sales using matrix visuals
---
### Tools & Skills Demonstrated:
* Data modeling and relationships
* Power Query for cleaning and transformation
* DAX for calculated fields and KPIs
* Advanced charting (bar, line, matrix, pie)
* Interactive filters and user-friendly design
---
This project not only enhanced my technical Power BI skills but also strengthened my ability to think like a business analyst — focusing on insights that drive action.