Fast Food Sales Data Analysis & Dashboard Creation Using Excel .
تفاصيل العمل
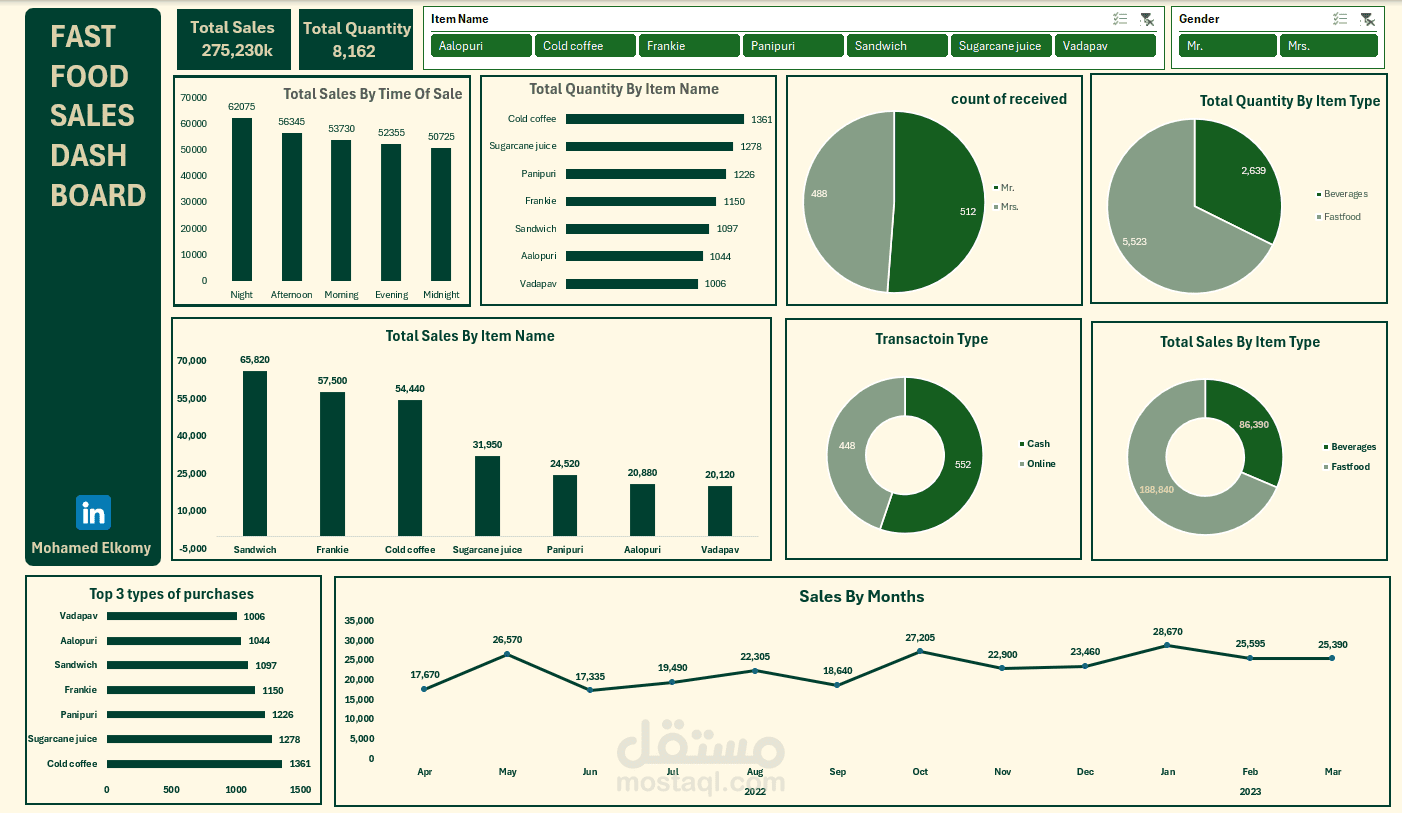
Excel Sales Data Analysis & Dashboard Creation
I performed a complete end-to-end data processing workflow in Excel, starting from data cleaning using Power Query to building an interactive and professional dashboard using Pivot Tables and charts.
Step 1: Data Cleaning (Power Query)
- Cleaned raw sales data and handled missing or blank values.
- Filled missing values in the `transaction_type` column using conditional logic based on `time_of_sale` and `received_by`.
- Removed extra spaces using `Text.Trim()` and standardized data formatting.
- Ensured consistent data types for all relevant fields.
Step 2: Data Analysis
Built 9 essential business insights using PivotTables:
1. Total Sales
2. Total Quantity Sold
3. Total Sales by Time of Sale
4. Total Quantity by Item Name
5. Count of Transactions by Receiver (`received_by`)
6. Total Quantity by Item Type
7. Total Sales by Item Name
8. Total Sales by Item Type
9. Count of Transactions by Payment Type (`transaction_type`)
Step 3: Dashboard Design
- Designed a clean and user-friendly dashboard in Excel.
- Created visual summaries using charts (Bar, Pie, Line).
- Used KPI cards to highlight key metrics (Total Sales, Quantity, Avg Transaction).
- Applied `Freeze Panes` to fix headers while scrolling.
- Used `Don't move or size with cells` for shapes and properly arranged layers.
- Ensured shapes and visuals stay fixed when new data is added.
Final Deliverable: A well-structured Excel dashboard that is dynamic, clean, and provides quick access to critical business metrics for better decision-making.