Coffee Shop Sales Dashboard
تفاصيل العمل
Tools Used: Microsoft Excel
Domain: Retail / Food & Beverage
Dataset Size: 149,116 records – 11 fields
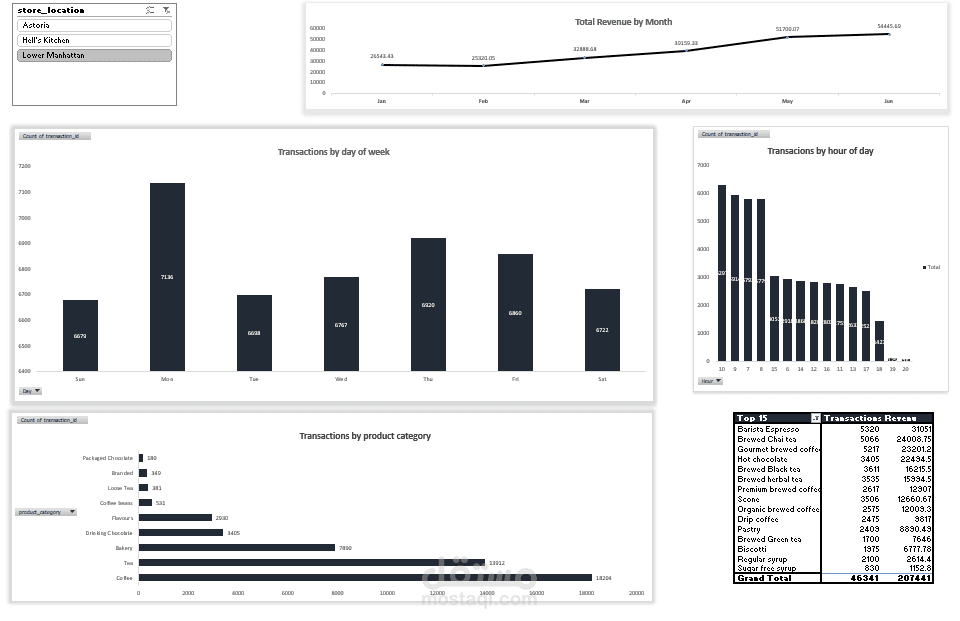
Project Overview:
In this project, I analyzed transaction data from a fictional coffee shop in NYC. The goal was
to explore sales trends and create a dashboard for performance insights.
Key Steps:
• Added calculated columns:
o Revenue (Price × Quantity)
o Month and Day of Week (as text)
o Hour (from transaction time)
• Built pivot tables to analyze:
o Revenue by Month
o Transactions by Day of Week and Hour
o Product Category performance
o Top 15 Products by Transactions and Revenue
• Designed an interactive dashboard using:
o Line & Column Charts
o Slicer for Store Location
o Clean layout with hidden pivot tables and no gridlines
Insights:
• Discovered peak sales times (morning & weekends)
• Identified best-selling product categories
• Recommended strategies for optimizing operations
Skills Demonstrated:
• Feature Engineering & Excel Functions (TEXT (), HOUR (), MONTH())
• Pivot Tables & Charts
• Dashboard Design
• Business Insight Generation