CRM Sales Dashboard
تفاصيل العمل
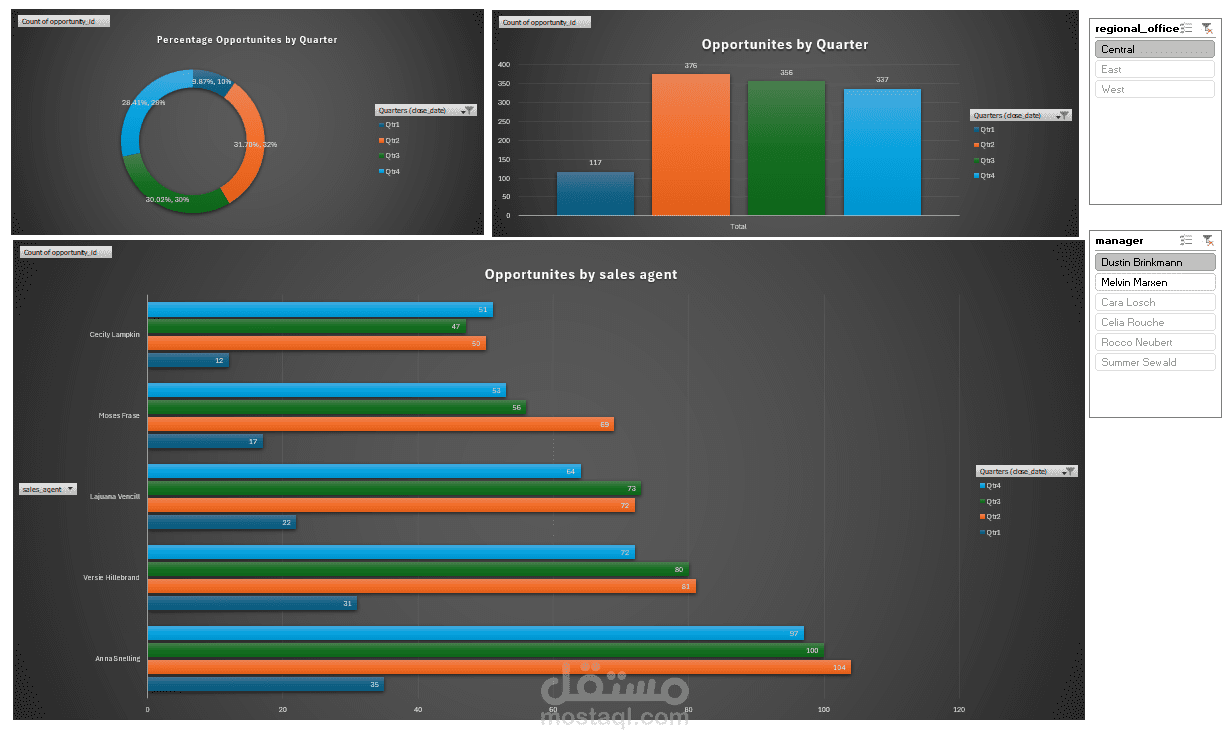
This project involved analyzing a sales pipeline dataset from a fictional company selling computer
hardware. The goal was to support sales managers in tracking quarterly team performance through
a dynamic dashboard.
Key Steps:
• Cleaned and joined two datasets: sales_pipeline.csv and sales_teams.csv
• Created pivot tables to:
o Track opportunities won by quarter
o Analyze win/loss rates over time
o Evaluate individual performance by sales agent
• Designed a dashboard including:
o Scorecard comparing Q4 vs Q3 performance
o Pie chart of deal outcomes
o Bar chart for agent performance
o Slicers by Manager and Regional Offic
Insights:
• Identified top-performing agents
• Highlighted underperforming regions
• Enabled dynamic filtering for more focused analysis
Skills Demonstrated:
• Data Cleaning & Transformation
• Lookup Functions (VLOOKUP / INDEX-MATCH)
• Pivot Table Analysis
• Interactive Dashboard Design
• Business Storytelling