hotel-revenue-analysis
تفاصيل العمل
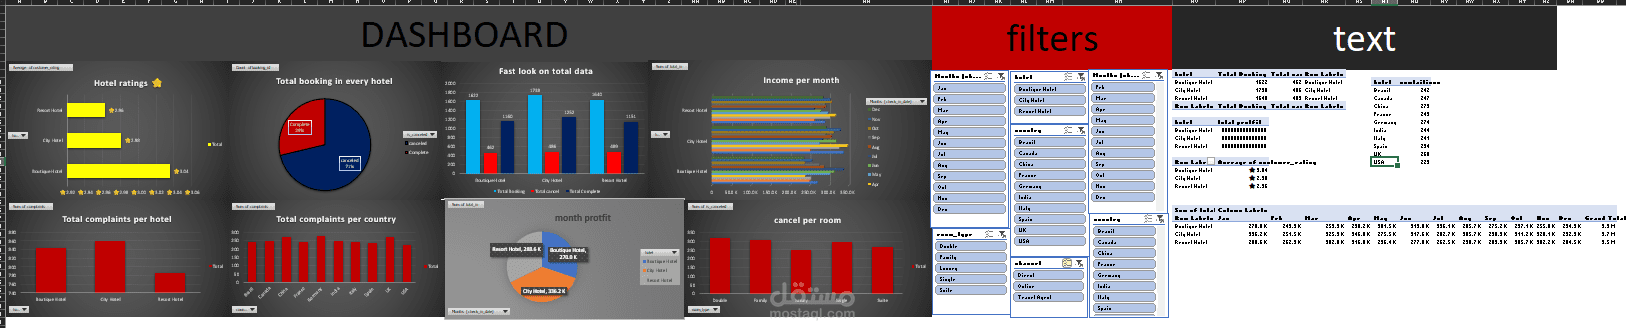
This project provides an interactive Excel Dashboard to analyze hotel revenue based on booking data.
The dashboard allows stakeholders to monitor key metrics such as revenue, booking trends, distribution by market segments, and performance by hotel types.
Tools Used
Microsoft Excel – Main tool used for building the interactive dashboard (pivot tables, charts, formulas, conditional formatting)
SQL – Used to clean and filter raw data before loading into Excel