Reatail Sales Analysis Project
تفاصيل العمل

# ️ Retail Sales Analysis with Python
This is an end-to-end data project exploring trends in retail sales using real-world transactional data. I cleaned, analyzed, and visualized retail sales data to uncover patterns, identify top-performing products, and evaluate customer purchasing behavior.
---
## Objective
To analyze key trends in retail transactions, customer behavior, and product performance.
**Key Focus:** What drives revenue in retail — and which products and customer segments are most valuable?
---
## ? Tools Used
- **Python** (Pandas, NumPy, Seaborn, Matplotlib)
- **Jupyter Notebook**
- **Power BI**
---
## ️ Data Collection
- `complex_retail_sales_data.csv` – Sourced from Kaggle (includes invoice-level sales data across products, customers, and countries)
---
## Key Questions Explored
- What are the top-selling products by revenue and quantity?
- Which countries contribute the most to sales?
- Are there any seasonal trends in sales volume?
- Who are the most valuable customers?
---
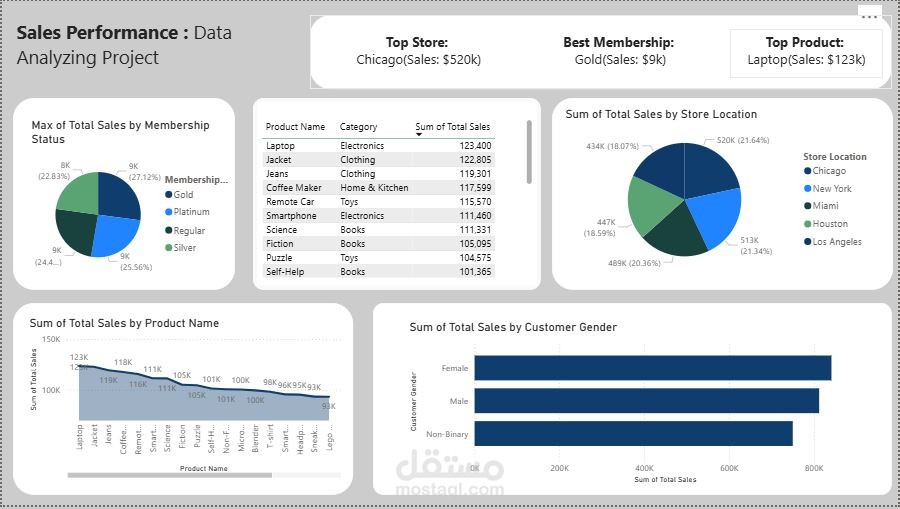
## Visual Insights
The interactive Power BI dashboard includes:
- Revenue trends over time
- Top countries by sales
- Product-level sales performance
- Customer segmentation
- Monthly and seasonal trends
---
## ️ About Me
I'm **Adam Abozaid**, a data analyst passionate about using data to uncover patterns and support smart business decisions.
This project demonstrates my ability to work across the full analytics lifecycle — from **data cleaning** to **analysis** and **interactive dashboard creation**.
---
## Contact
I'm open to feedback, collaborations, and new opportunities.
adamabozaid18@gmail.com