Store Sales Analysis Project
تفاصيل العمل

️ Store Sales Analysis with Python
This end-to-end data project analyzes store sales performance using real-world datasets from Kaggle. I performed data cleaning, exploration, and visualization to identify customer trends, best-selling products, and sales patterns.
---
Objective
To explore customer behavior, product performance, and time-based sales trends to uncover actionable business insights.
---
? Tools Used
- **Python** (Pandas, NumPy, Seaborn, Matplotlib)
- **Jupyter Notebook**
- **Power BI**
---
️ Data Collection
All datasets were sourced from Kaggle:
- `sales.xls` – Transaction-level sales data
- `products.xls` – Product catalog with categories and prices
- `customers.xls` – Customer profiles and demographics
---
Key Questions Explored
- Which products generate the most revenue?
- What is the monthly and yearly trend in sales?
- Who are the most valuable customers?
- Which locations or customer segments drive the highest sales?
- Are there seasonal patterns in product demand?
---
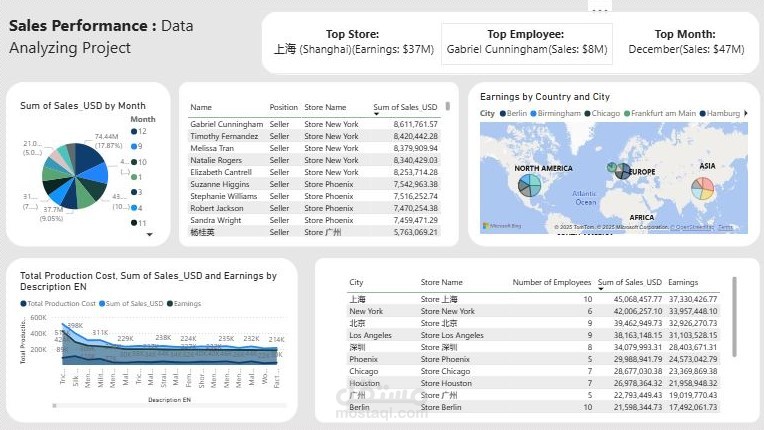
## Visual Insights
The interactive Power BI dashboard showcases:
- Sales trends over time (monthly/yearly)
- Top-performing products and categories
- Revenue by customer segments
- Sales heatmaps by region or store
- Customer Lifetime Value (CLV) insights
---
## ️ About Me
I'm **Adam Abozaid**, a data analyst passionate about using data to uncover stories and support decisions.
This project demonstrates my full data workflow — from **data cleaning and analysis**, to **insightful dashboard creation**.
---
Contact
I'm open to feedback, collaborations, and opportunities.
adamabozaid18@gmail.com