Pizza Sales
تفاصيل العمل
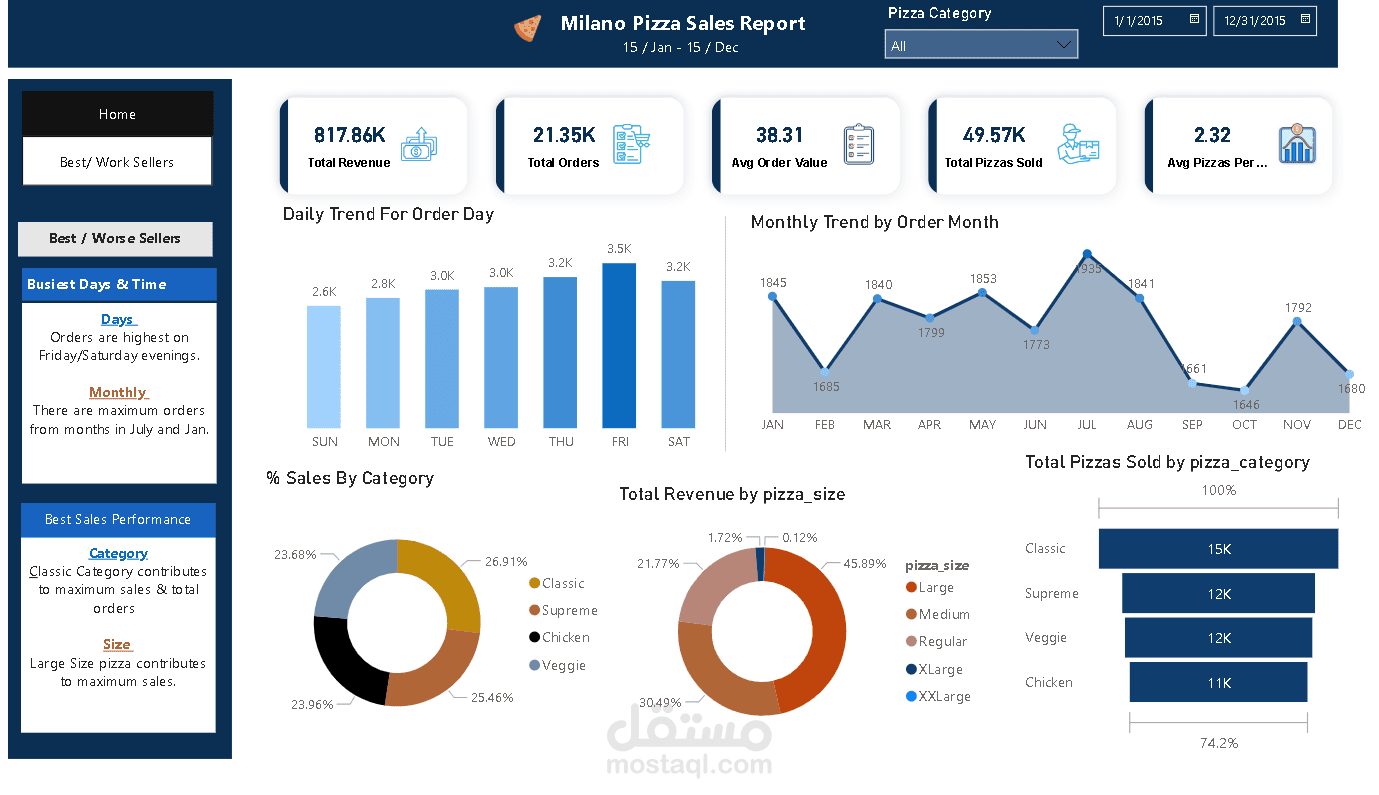
Milano Pizza Sales Report
1. Project Objective:
Analyzing Milano Pizza sales data to identify patterns affecting revenue, determine the best times to boost sales, and assess the performance of different pizza categories. This helps management make data-driven decisions.
2. Challenges Faced:
Cleaning data and handling missing or inconsistent values.
Designing interactive dashboards that make data easier to understand.
Defining key metrics such as total revenue, total orders, average order value, and category performance.
Analyzing seasonal and daily trends to identify peak sales periods.
3. Tools Used:
Power BI for creating interactive reports.
DAX for calculating key metrics such as total revenue and average pizzas per order.
SQL/Excel for data cleaning and analysis before importing into Power BI.
Key Performance Indicators (KPIs):
1️⃣ Total Revenue: $817.86K
2️⃣ Total Orders: 21.35K
3️⃣ Average Order Value: $38.31
4️⃣ Total Pizzas Sold: 49.57K
5️⃣ Average Pizzas Per Order: 2.32
Other Performance Insights from the Report:
Daily Order Trend:
Orders peak on Friday and Saturday evenings.
Monthly Order Trend:
The busiest months are July and January.
Sales by Category (% Sales by Category):
The best-selling category: Classic (26.91%)
Followed by: Supreme (25.46%)
Total Revenue by Pizza Size:
Large pizzas contribute the most to revenue (45.89%)
Followed by Medium (30.49%) and Regular (21.77%)
Total Pizzas Sold by Category:
Classic: 15K
Supreme: 12K
Veggie: 12K
Chicken: 11K