Analyze Social Media Engagementِ
تفاصيل العمل
Social Media Data Analysis using Excel
Performed data cleaning and analysis on a dataset containing social media posts with fields: post_id, platform, post_type, post_time, likes, comments, shares, post_day, sentiment_score.
Added a calculated column for Engagement:
Engagement = Likes + Comments + Shares
Extracted key insights:
- Total number of posts
- Engagement by platform and post type
- Best posting days and times
- Sentiment score analysis
- Top 5 posts with the highest engagement
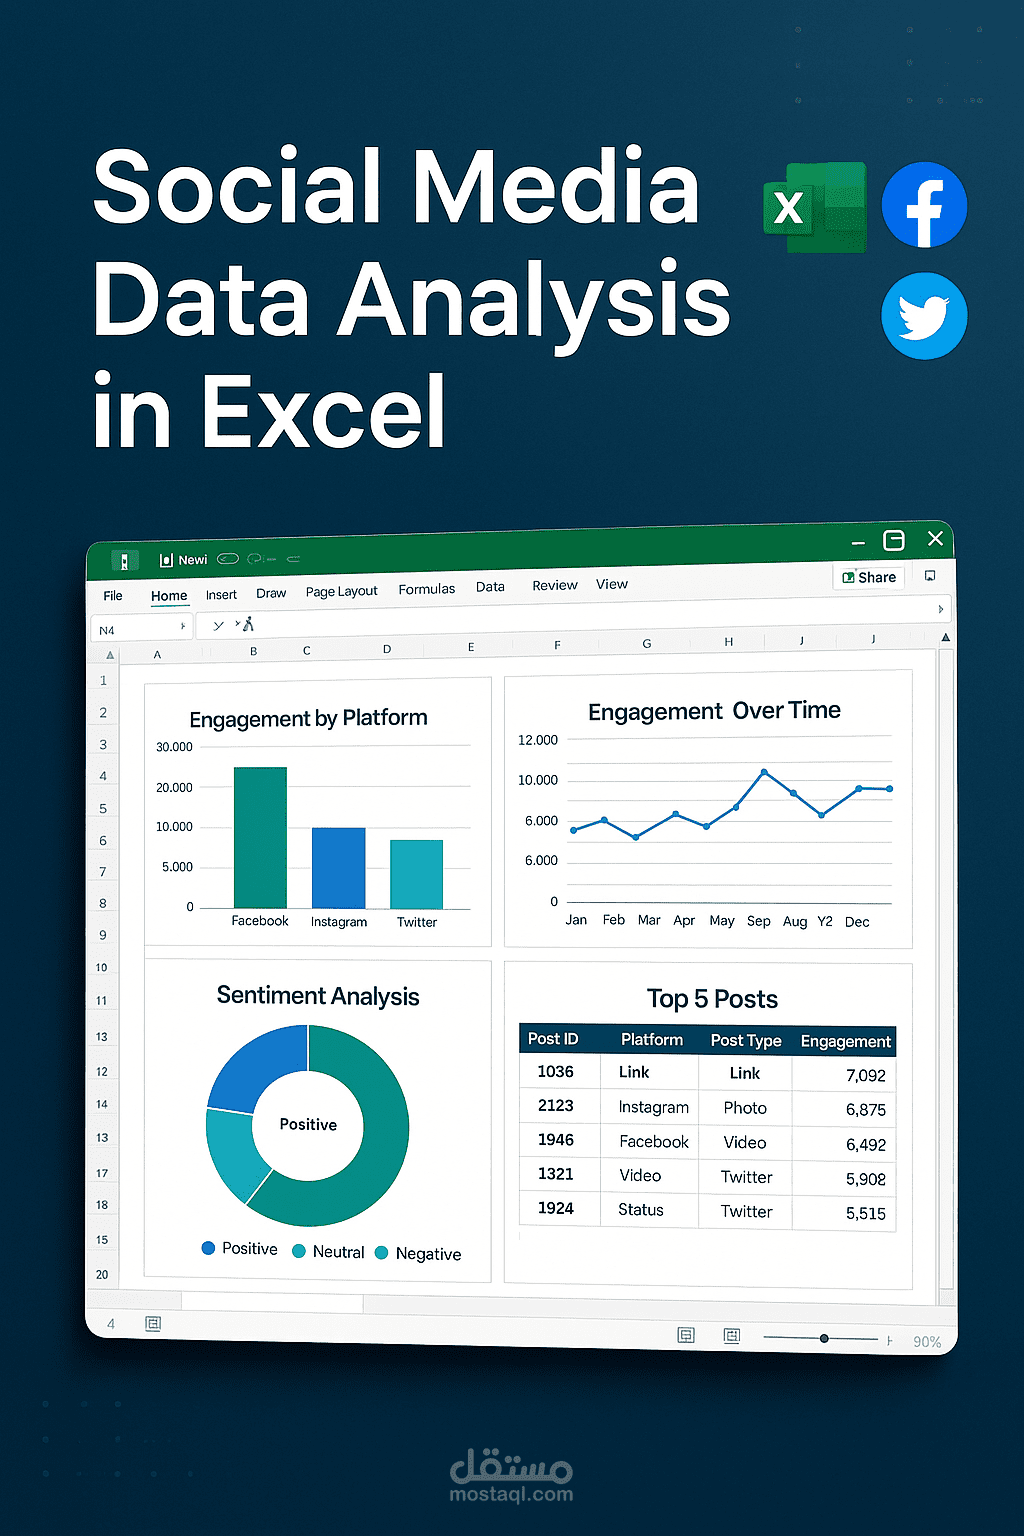
Created clear and informative charts for each analysis:
- Bar charts for engagement by post type and platform
- Line charts for engagement over time
- Pie/Donut charts for sentiment distribution
- Column chart for top 5 performing posts
Final report organized into multiple Excel sheets:
- Overview
- Engagement Analysis
- Time Analysis
- Sentiment Analysis
- Top 5 Posts
- Raw Data
-Writing a summary report and suggestions for the best publishing application, the best publishing time and type of publications.
Used pivot tables, sorting, filtering, formulas, and charts for easy interpretation.
Tools: Microsoft Excel
