Analyze Sales Data Using Excel
تفاصيل العمل
Excel Sales Data Analysis & Dashboard
I performed a complete analysis of a sales dataset using Excel, with the following key steps and insights:
1. Data Preparation:
- Used Power Query to clean and transform the data.
- Created a new column to classify orders as:
- HVO (High Value Order) if the order amount ≥ 3500
- LVO (Low Value Order) if the order amount < 3500
2. Pivot Table Analysis:
Sheet 1: Overall Summary
- Total Sales
- Total Units Sold
- Total Number of Orders
Sheet 2: Top Performers
- Identified the Top 7 Sales Representatives based on total sales revenue.
Sheet 3: Regional Performance
- Total Sales and Units Sold by each region.
Sheet 4: Time-Based Analysis
- Sales breakdown by year and by quarter over a 3-year period.
Sheet 5: Product Insights
- Calculated the average selling price of each product.
Sheet 6: HVO vs LVO Comparison
- Compared the total units sold and total sales amount for HVO and LVO categories.
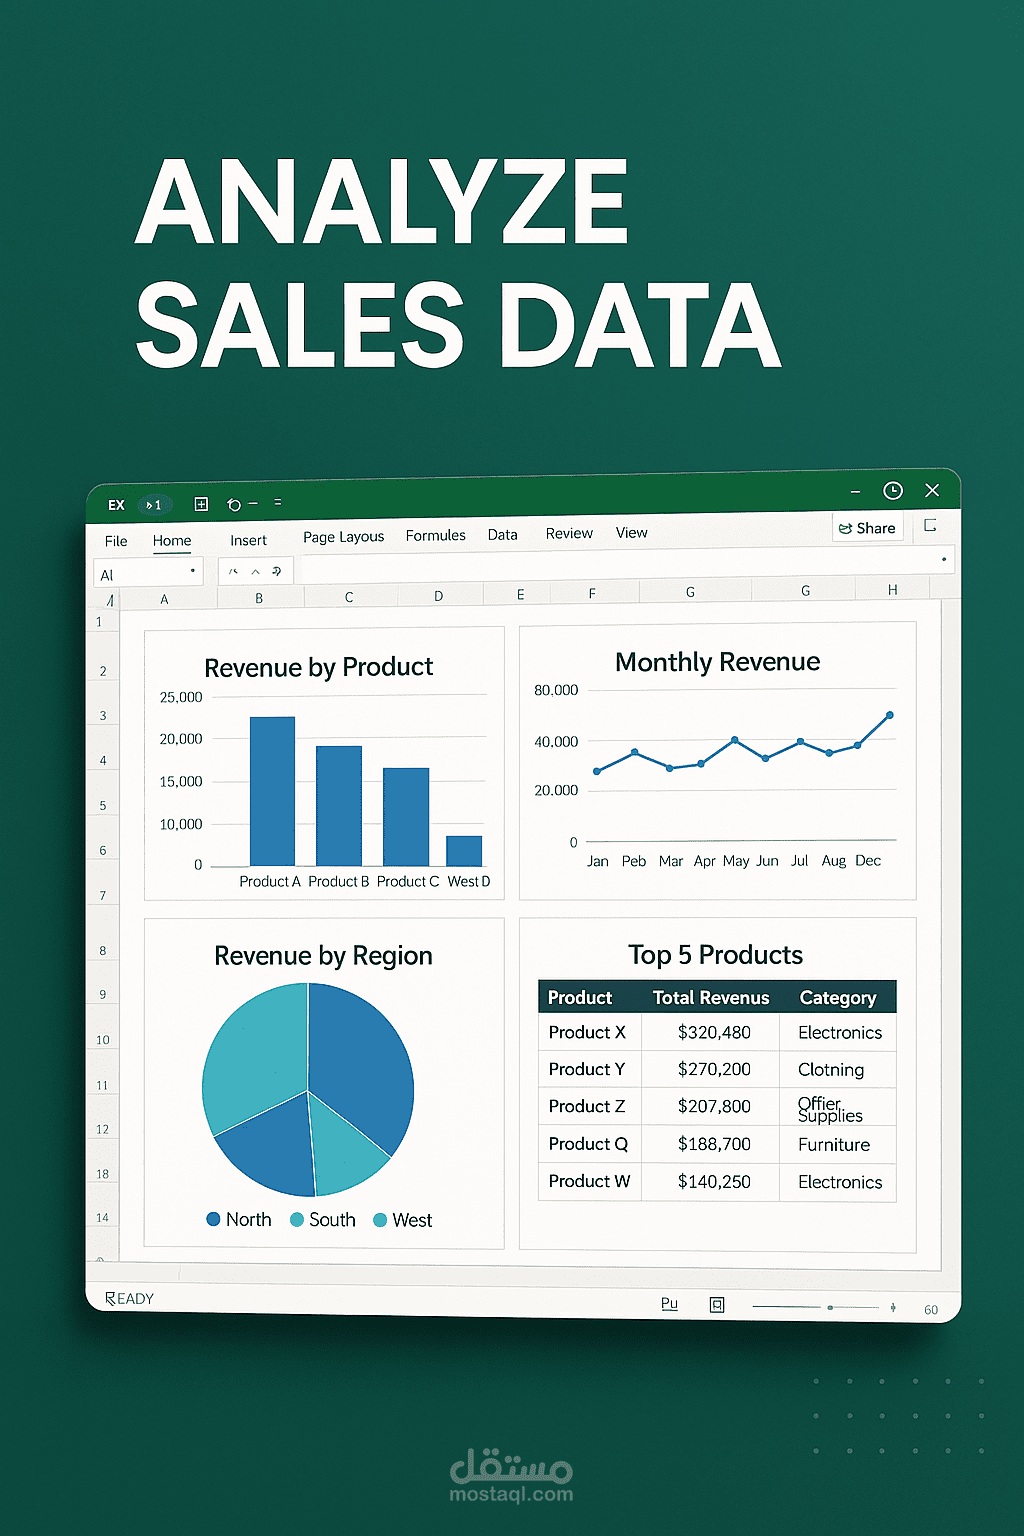
3. Dashboard:
- Created a preliminary interactive dashboard that summarizes all the key insights visually for better decision-making.
Tools Used: Excel, Power Query, Pivot Tables, Data Visualization
This project showcases strong skills in data cleaning, transformation, and insight extraction, along with effective visualization.