Adidas US Sales Dashboard – Business Insights using SQL & Power BI
تفاصيل العمل

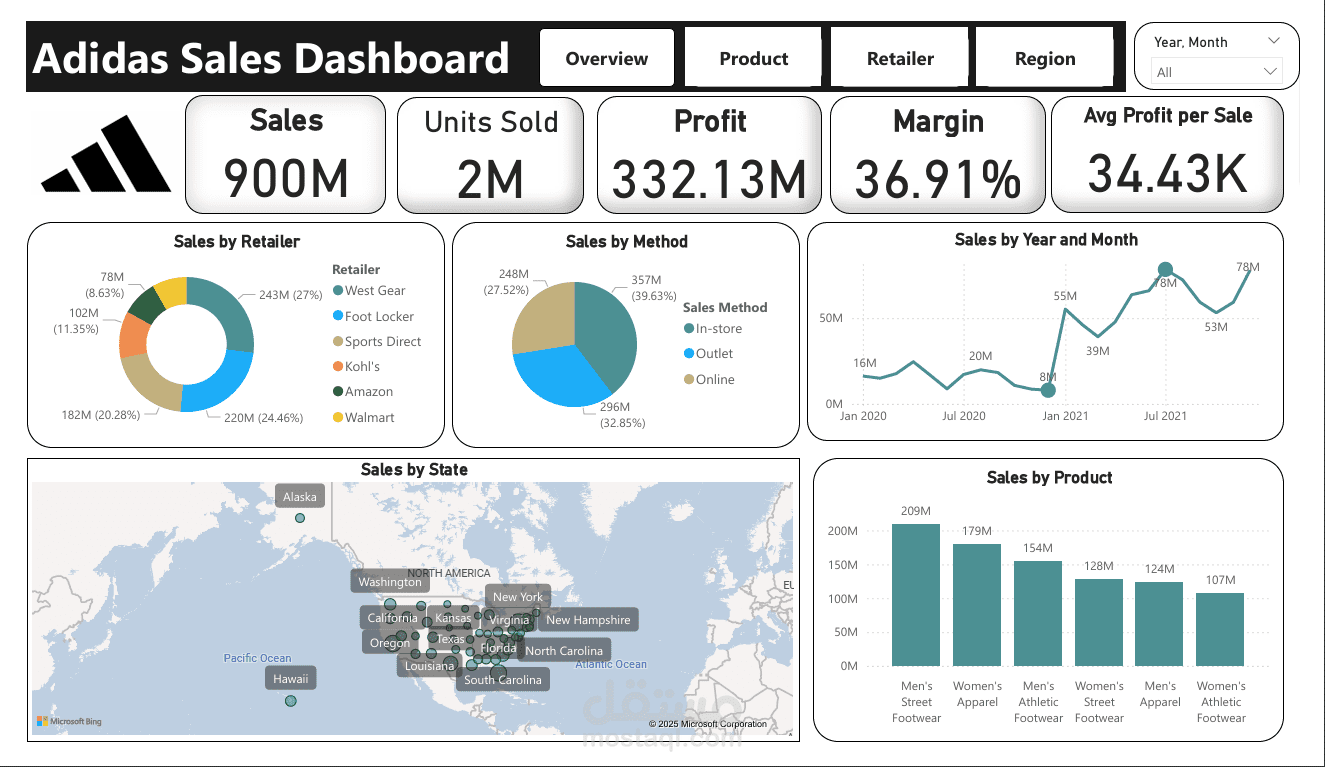
After analyzing Adidas sales data in the US market using SQL, I designed this interactive dashboard in Power BI to display key performance indicators:
KPIs:
Sales: $900M
Units Sold: 2M
Profit: $332M
Margin: 36.91%
Avg Profit per Sale: $34.4K
? Goal: Not only to know who sold the most, but who earns the smartest!
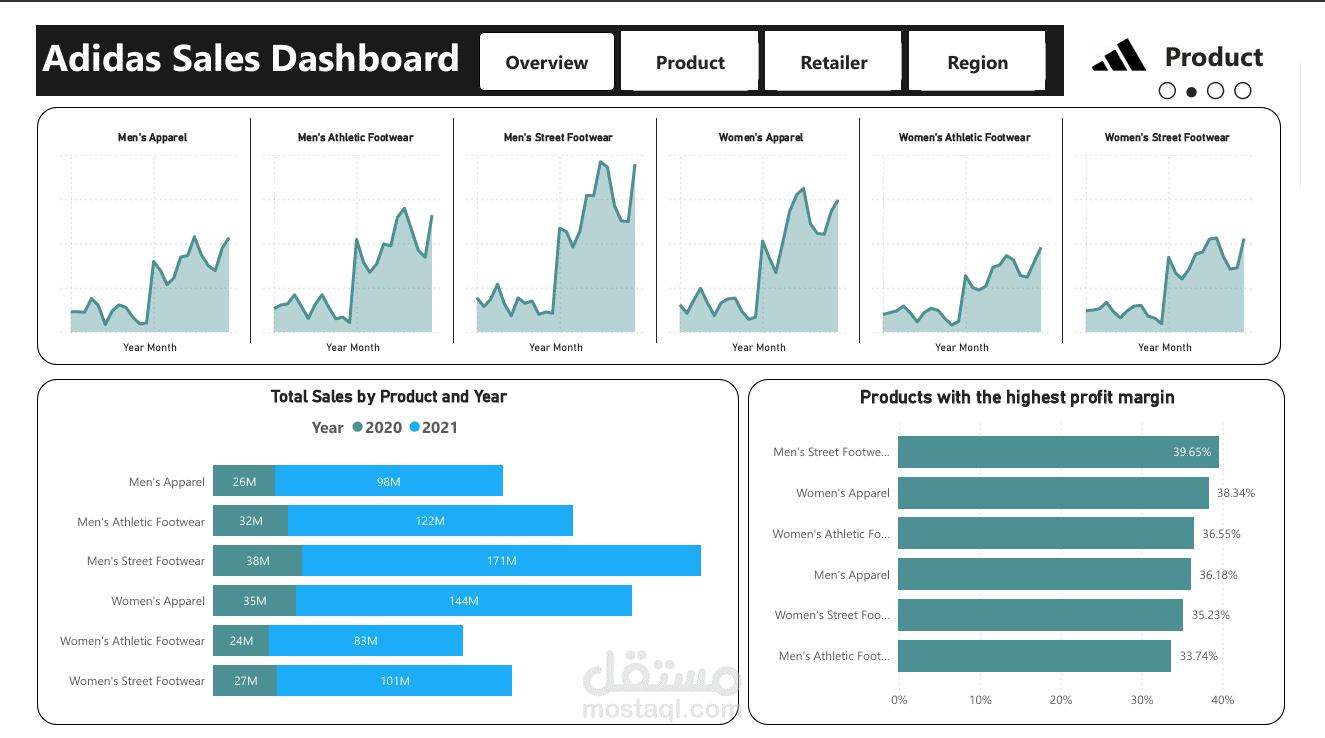
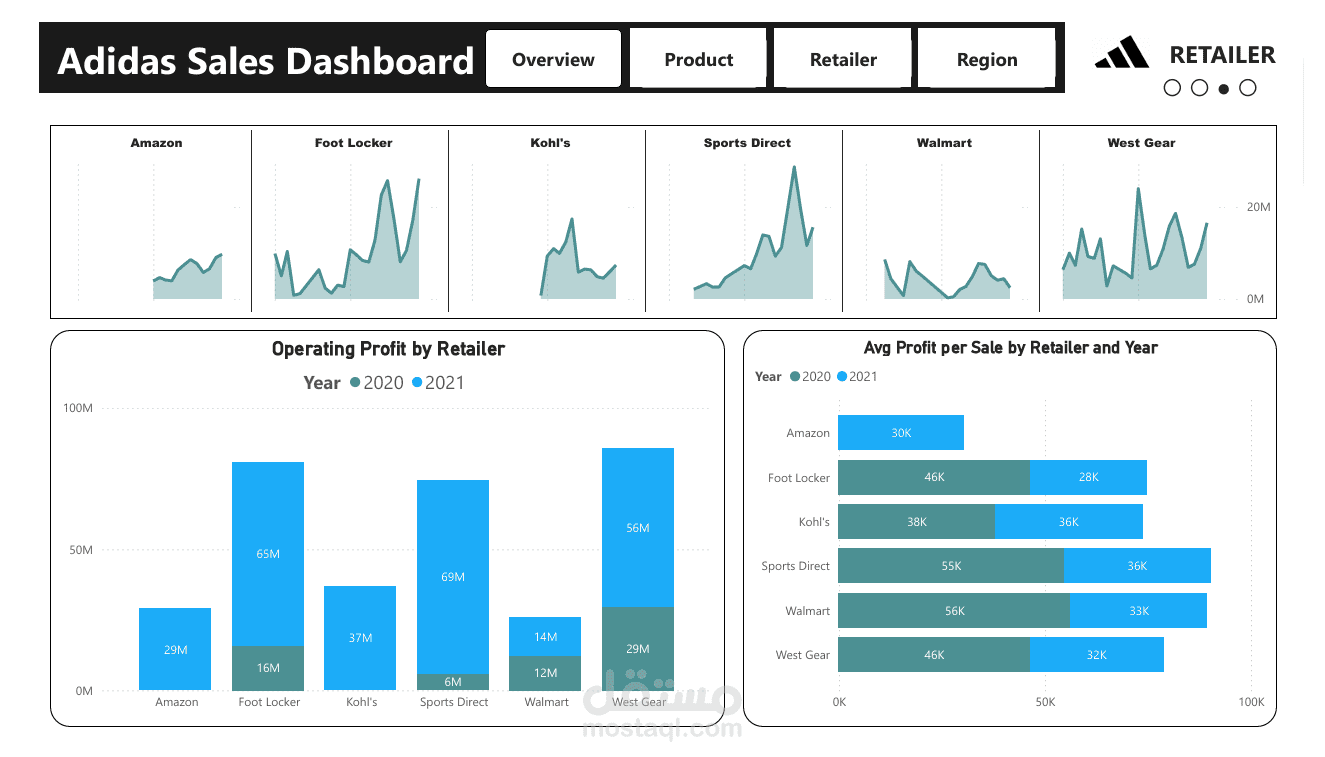
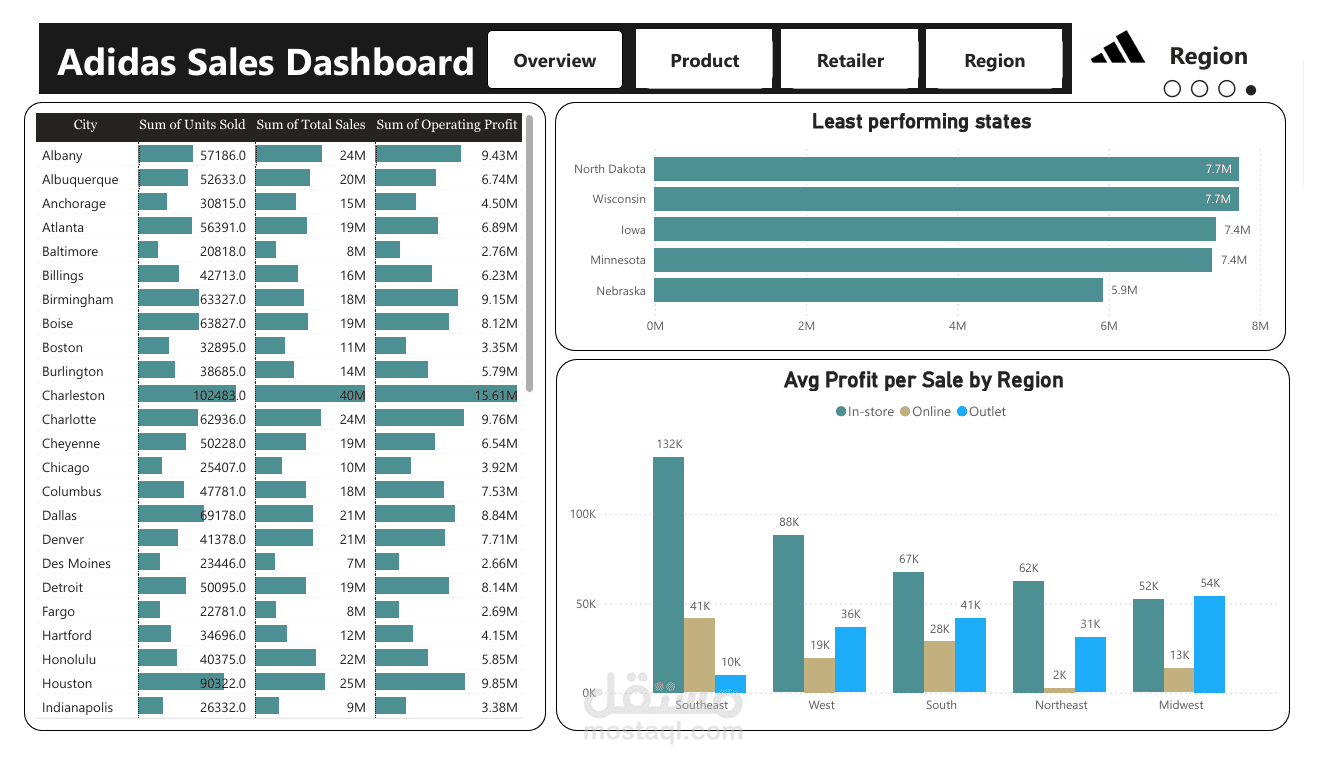
The dashboard is divided into tabs for easy analysis: Overview – Product – Retailer – Region
Analysis Includes:
- Sales by Product, Seller, Channel, and Region
- Comparison of 2020 vs. 2021 Profit and Efficiency
- Identifying the Best and Worst Channels and States
- Understanding the True Efficiency of Each Sale
Tools used:
- SQL Server
- Power BI Desktop