Formula one Report (1950-2020)
تفاصيل العمل

This project presents an interactive Power BI dashboard that analyzes historical Formula One data from 1950 to 2020. It offers insights into key statistics including the number of constructors, circuits, drivers, and Grand Prix events. The dashboard is divided into three main sections:
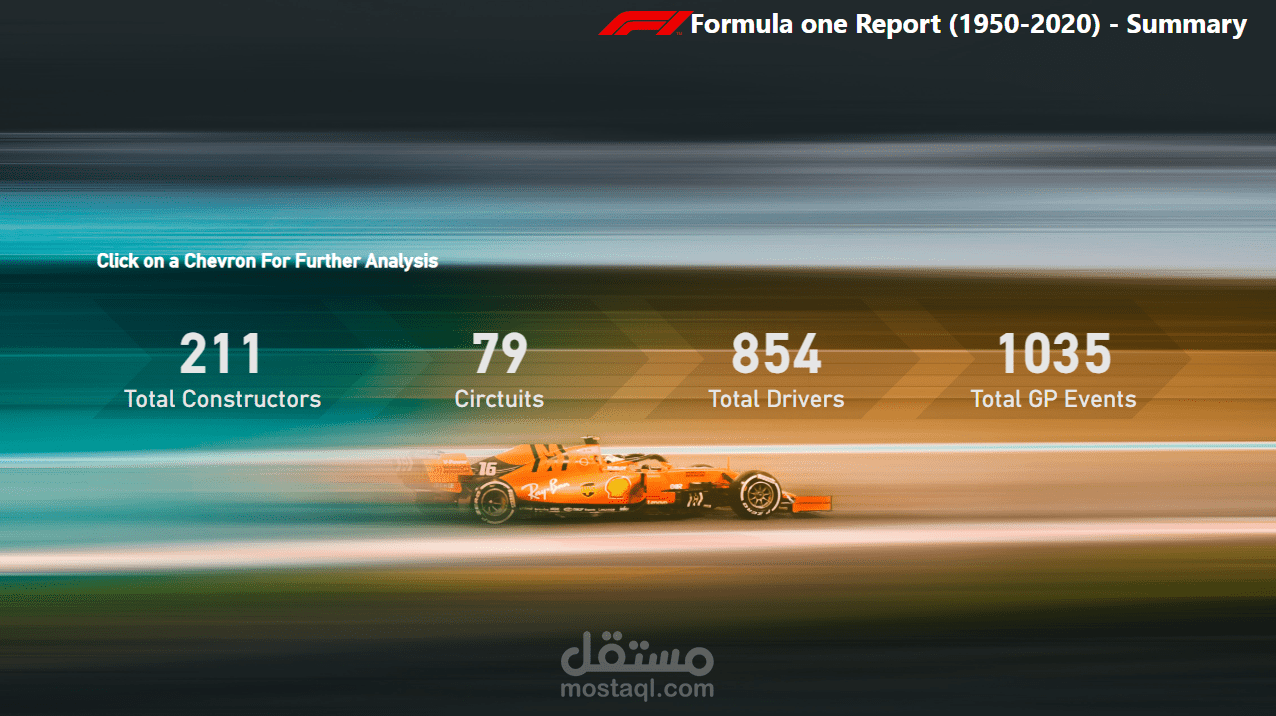
Summary View: Highlights overall metrics like total drivers (854), constructors (211), GP events (1035), and circuits (79).
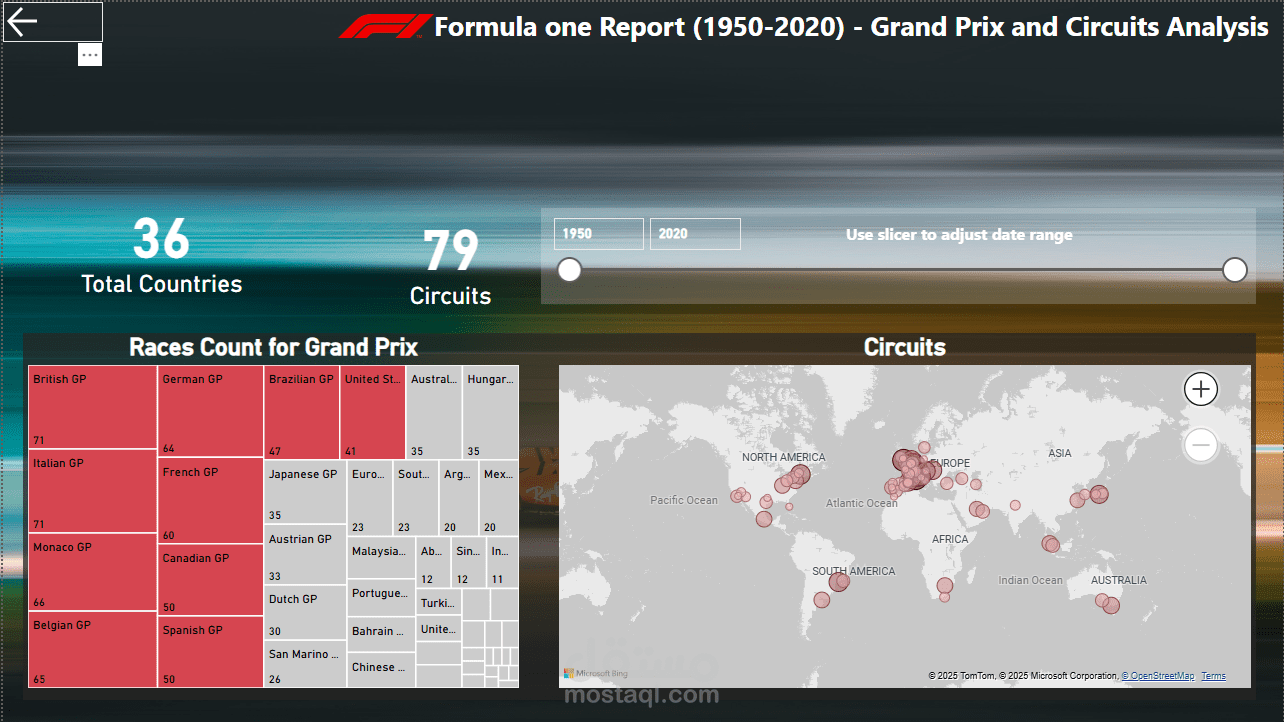
Grand Prix & Circuits Analysis: Visualizes race counts for each Grand Prix, country participation (36 total), and a world map showing circuit locations.
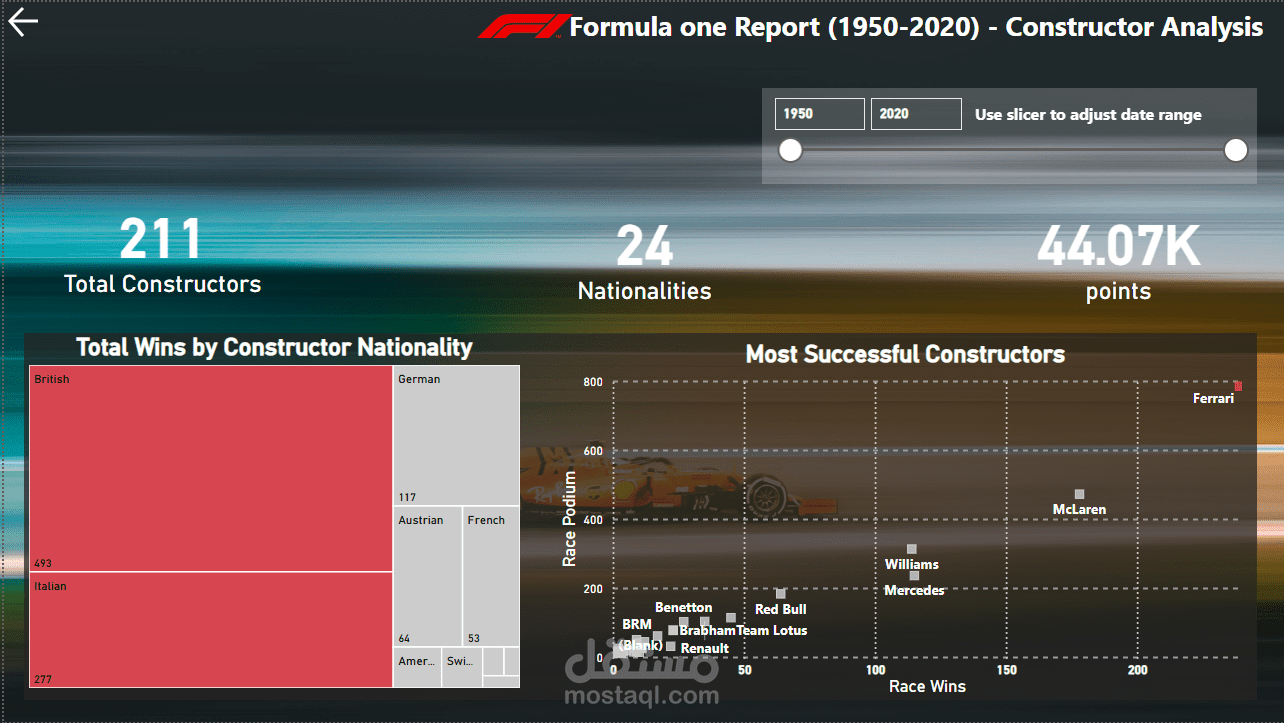
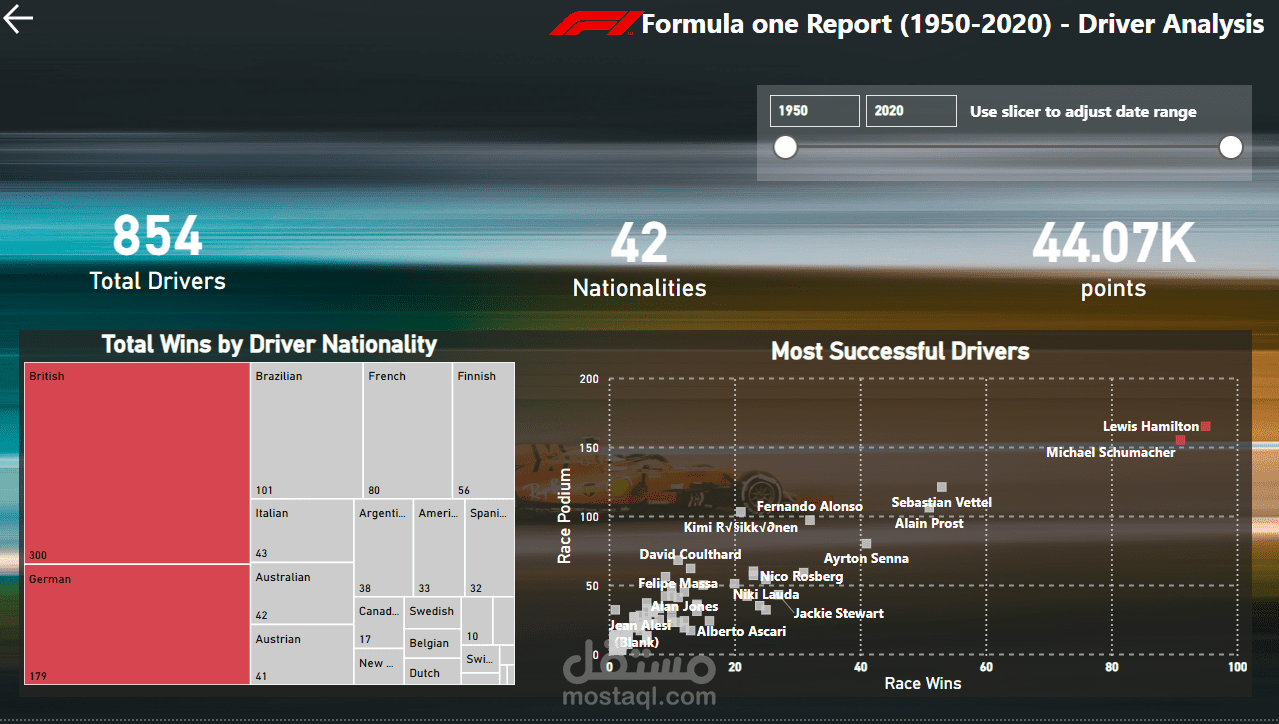
Driver Analysis: Examines total wins by driver nationality (42 nationalities), total points earned (44.07K), and showcases the most successful drivers in terms of wins and podiums.
The dashboard enables time-based filtering for dynamic exploration and provides clear visual storytelling through charts, maps, and interactive components.