Walmart Data Analysis
تفاصيل العمل
Project Title:
Walmart Dashboard
Overview
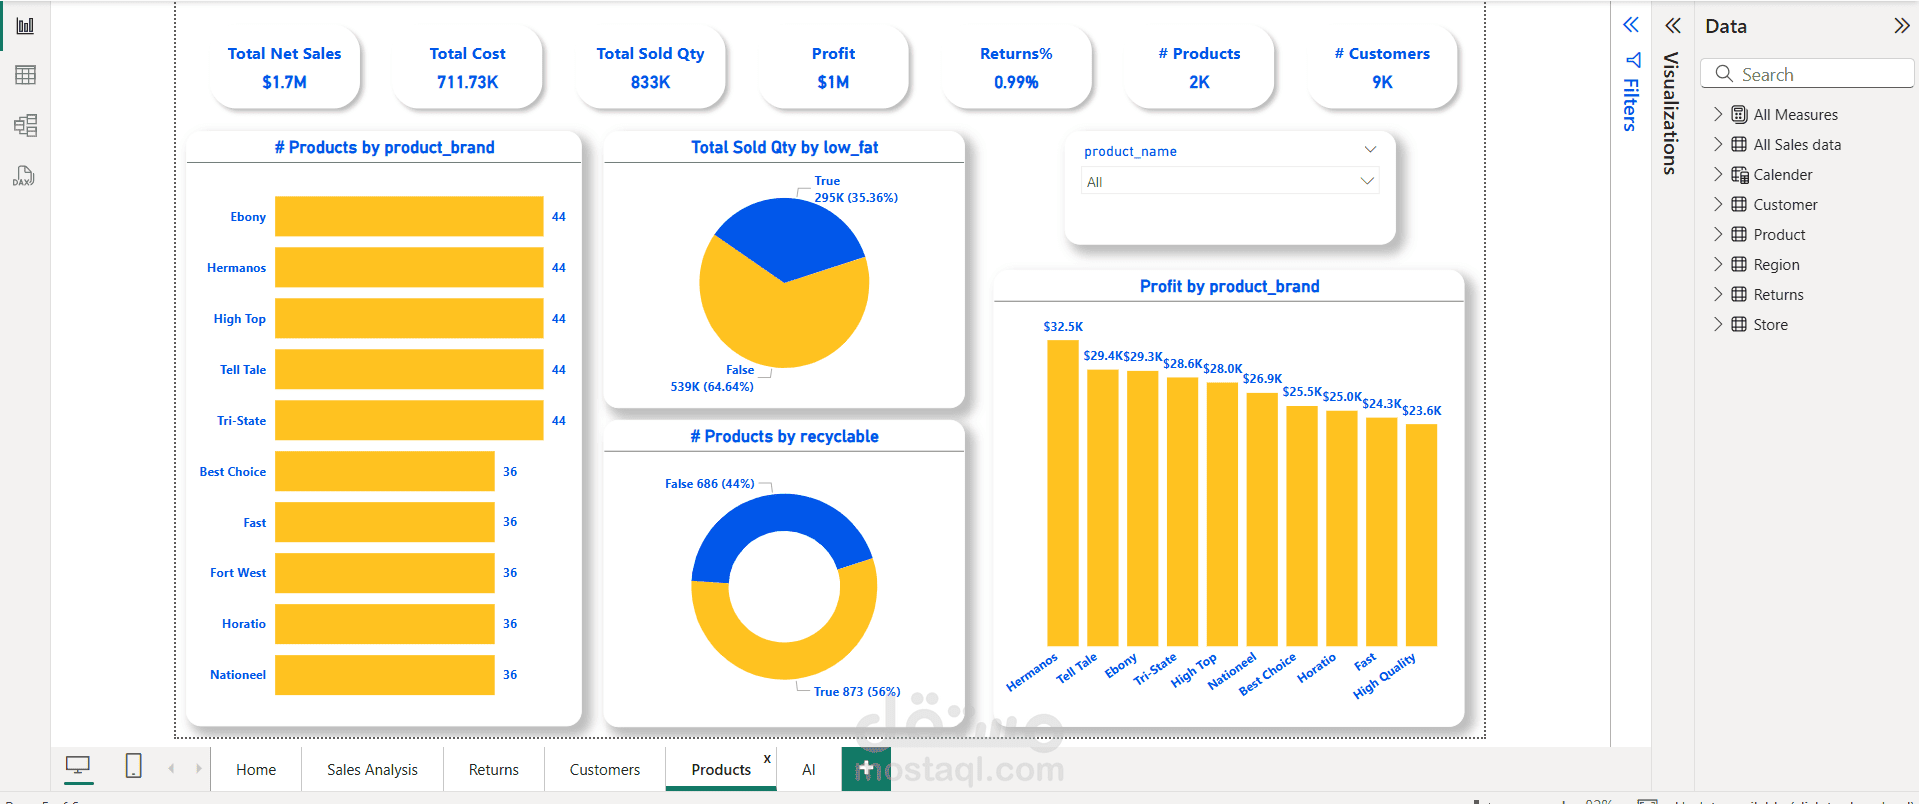
The Walmart Dashboard is a dynamic, interactive visual tool built using Power BI, designed to offer deep insights into sales performance, returns, customer behavior, and product details. It serves as a central reference point for key business metrics and trends.
? Tools & Technologies Used
Power BI – For data visualization and report building
Power Query – For data extraction, transformation, and loading (ETL)
DAX (Data Analysis Expressions) – For calculated columns, measures, KPIs, and advanced time intelligence
Key Features & Insights
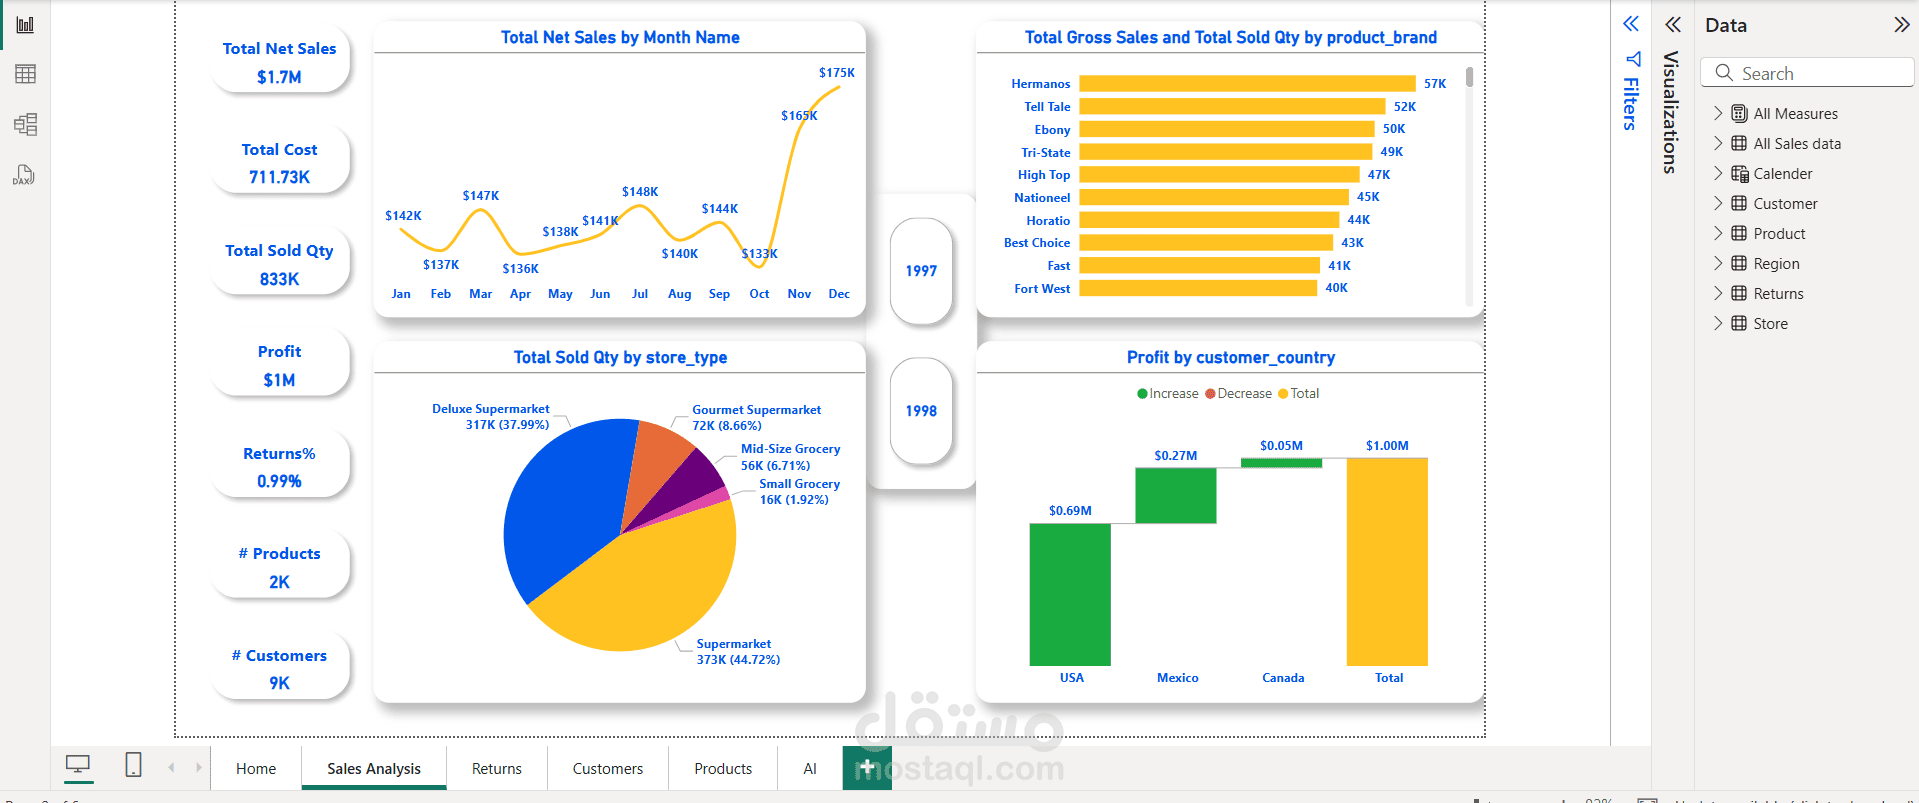
Sales Analysis
Total Sales, Net Sales, Sales by Region/Category/Date
YoY and MoM comparisons
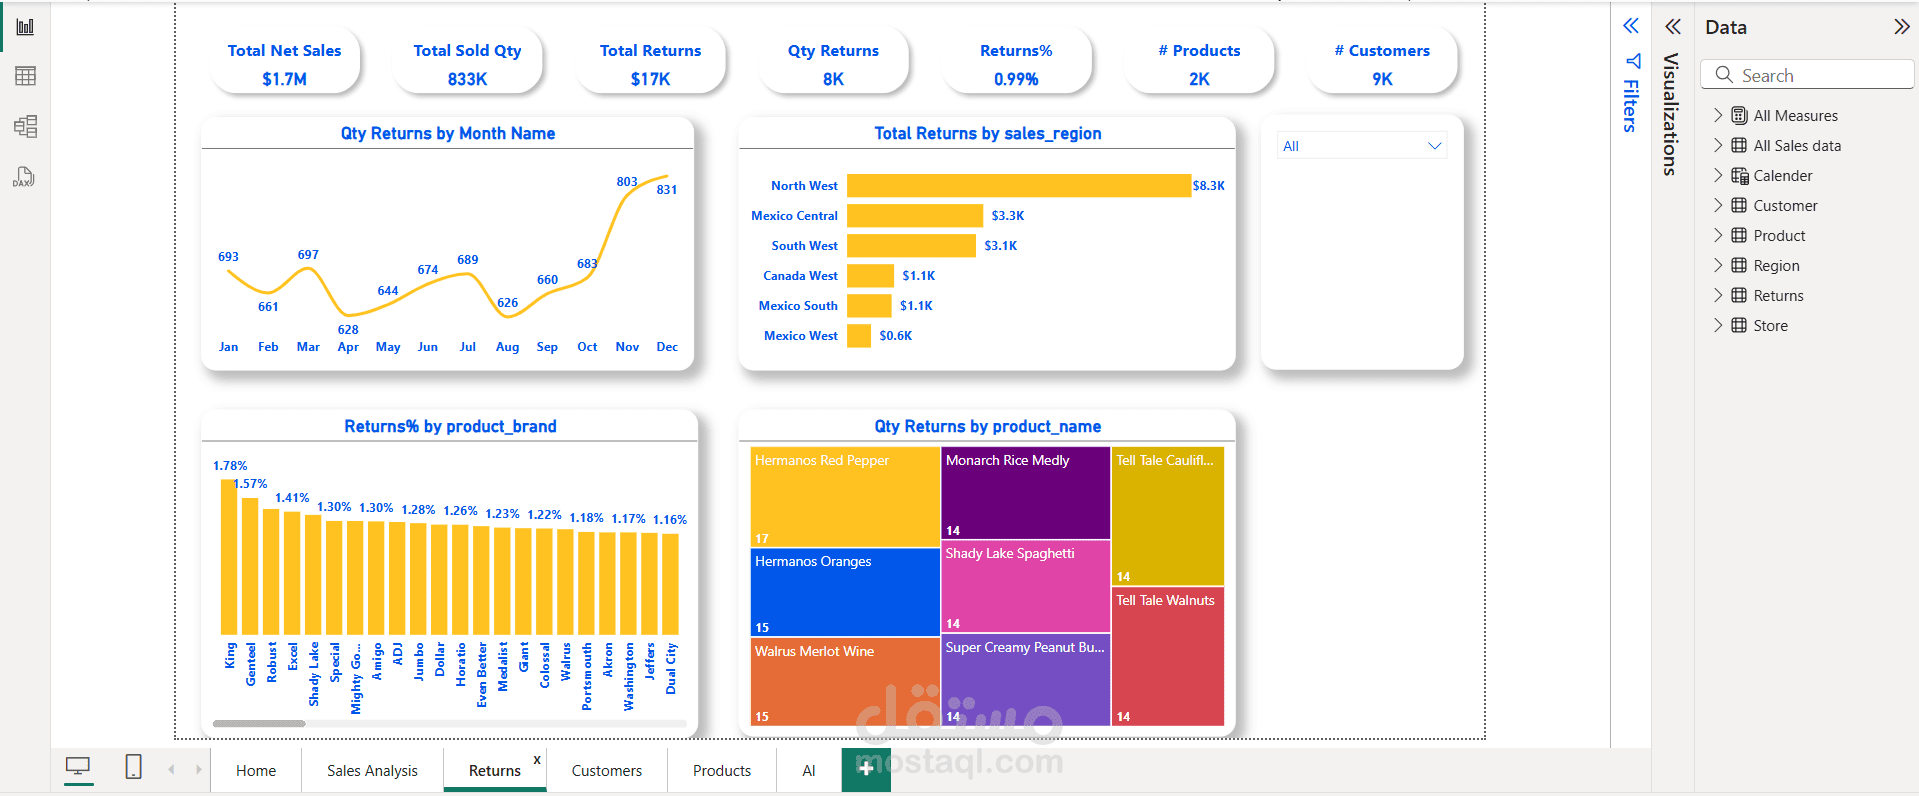
Returns Dashboard
Return Rate %, Return Reason Trends, Net Revenue after Returns
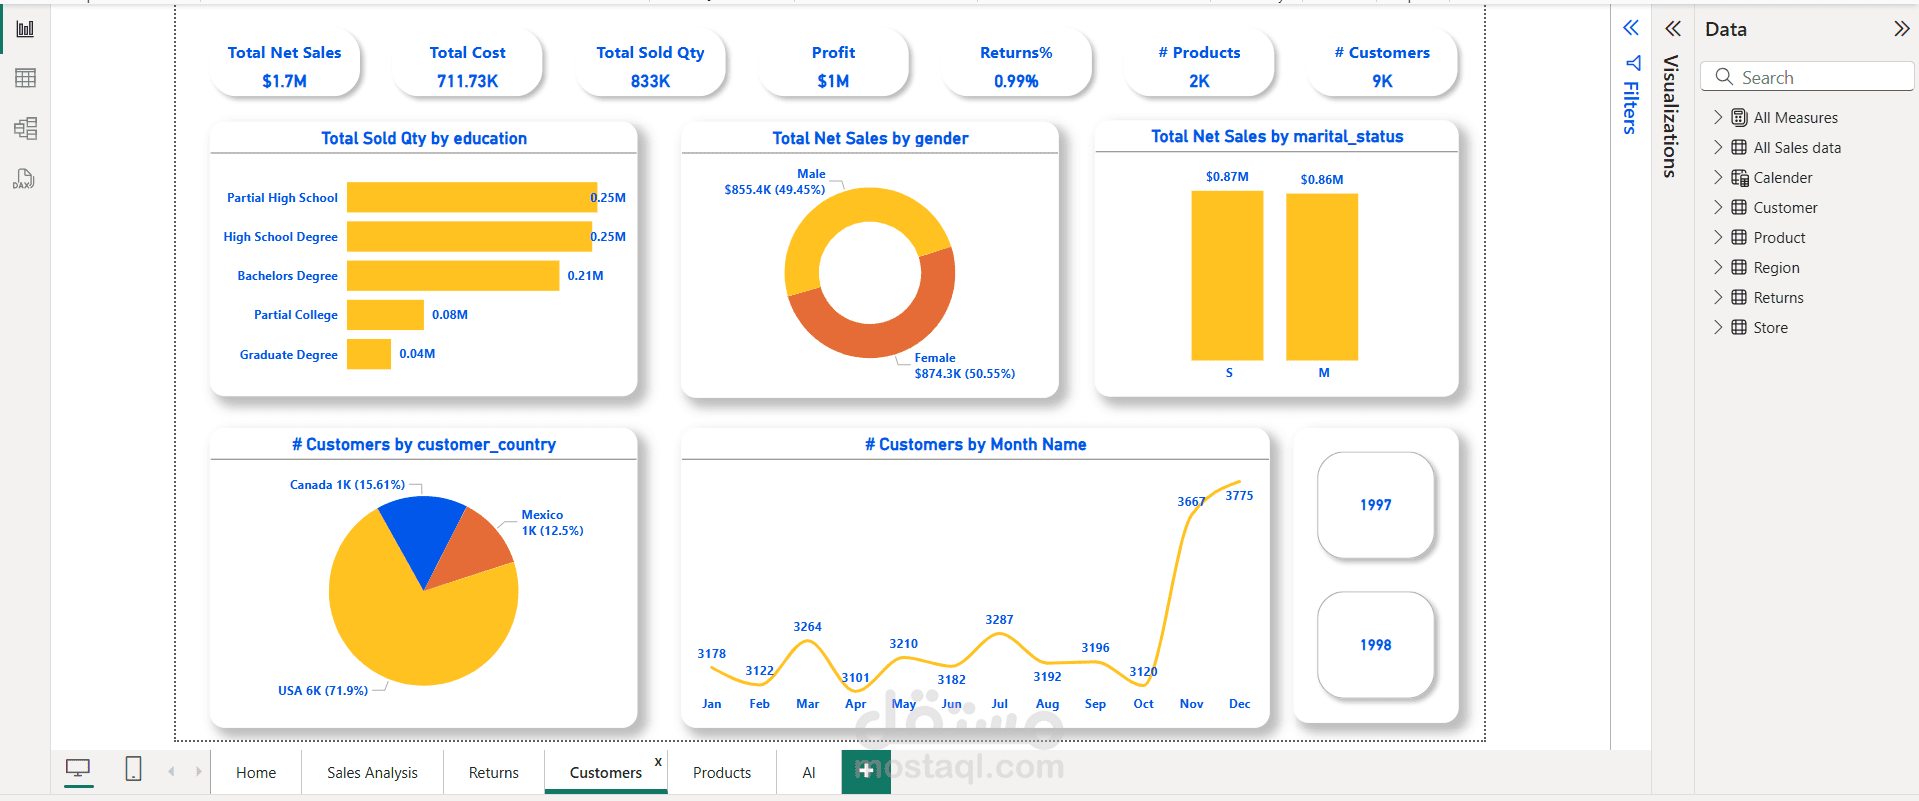
Customer Overview
Customer segmentation by region, gender, and frequency
Average purchase value, return behavior per customer group
Product Insights
Best/Worst selling products
Sales by product category/subcategory
Profitability analysis
Filters & Slicers
Dynamic filtering by time, region, product category, and customer type
يوجد فيديو مرفق مع العمل لتوضيح الداشبورد و الاجابة علي كافة البيانات بالرسومات