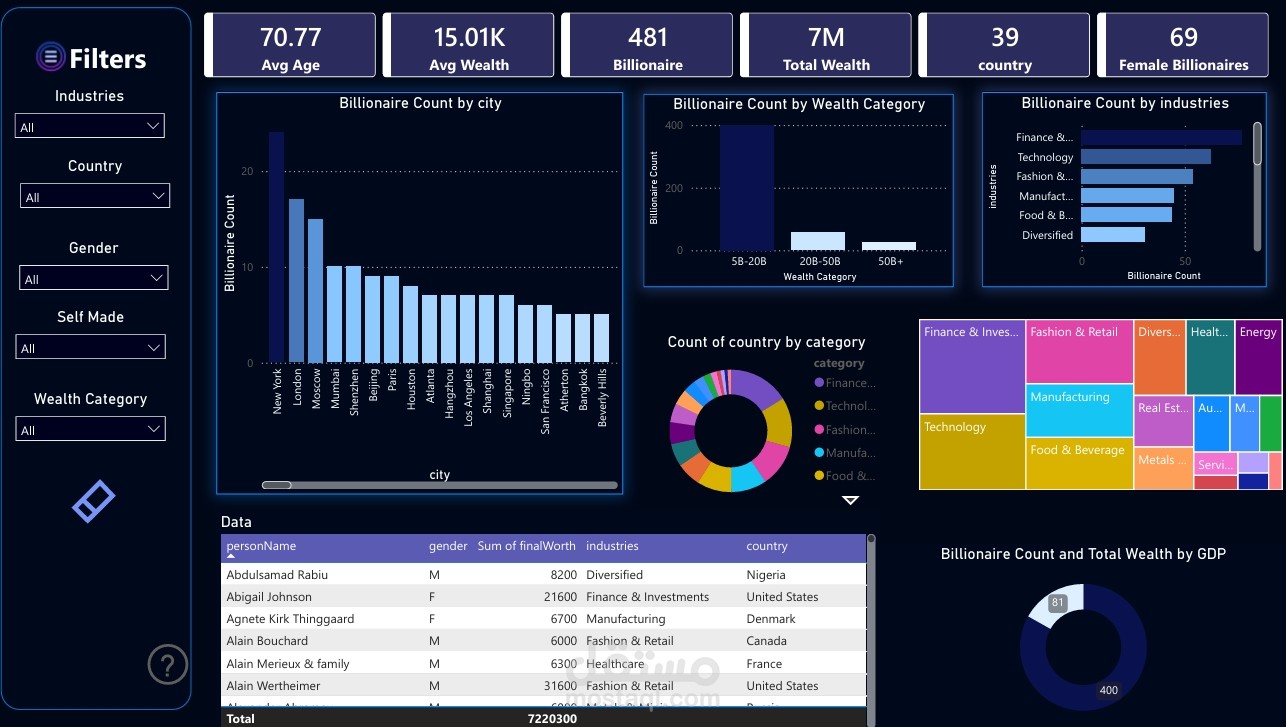
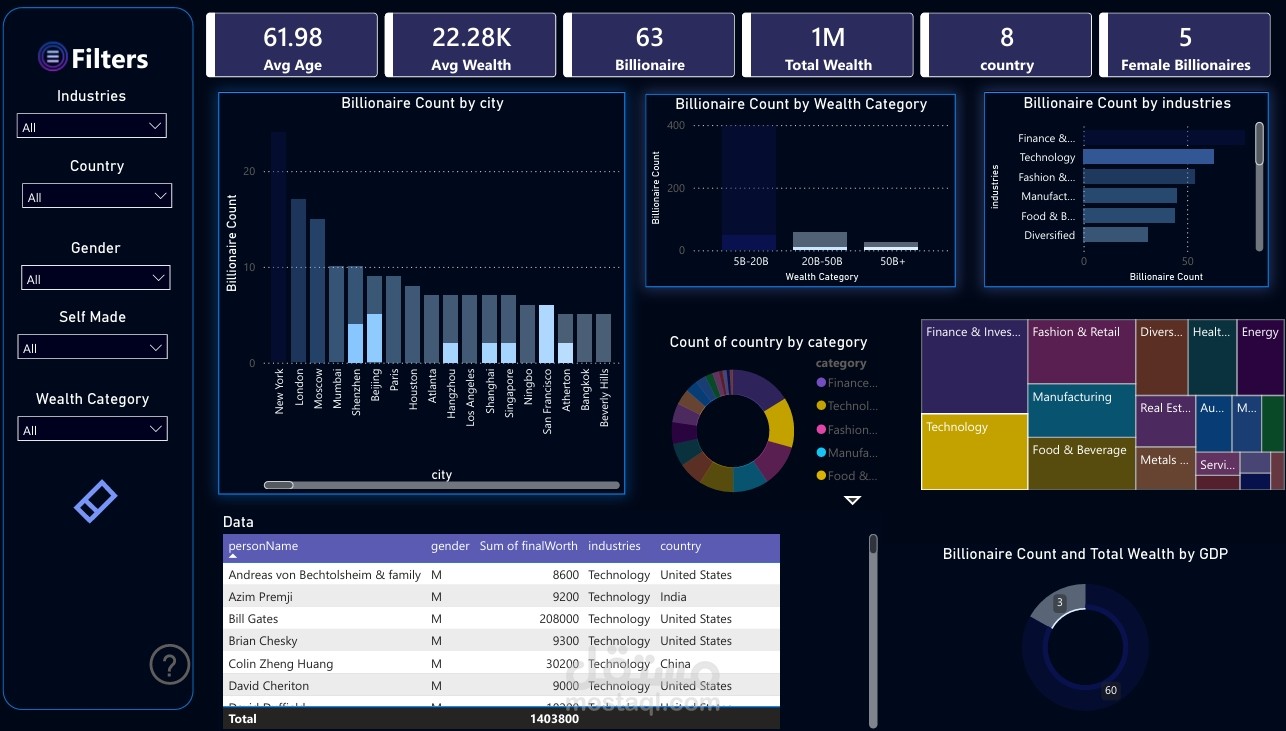
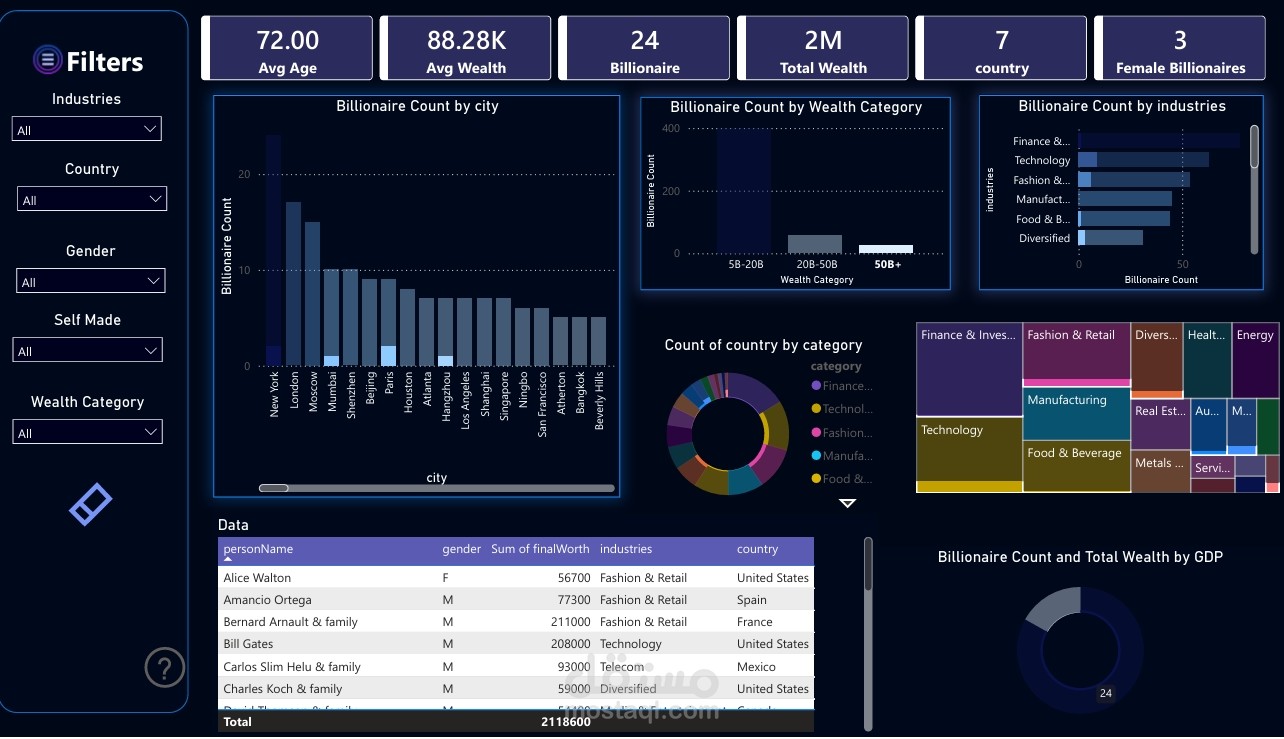
Billionaires Statistics Dataset
تفاصيل العمل
I completed a full data analysis project for a coffee business, covering sales performance, employee salary trends, and customer geography. The dataset included multi-month transactions and daily quantity tracking.
What I Analyzed
Daily Quantity Trends – tracked fluctuations from 8 to 28 units per day
Monthly Salaries – visualized from January to December (peak at $448.1, low at $3.2)
Geographic Distribution – identified that 79.2% of sales come from the US
Coffee Type Breakdown – 100% analysis of product preferences (Lib type shown)
"Give me your coffee shop, retail, or restaurant data – and I will deliver a complete dashboard showing sales by country, daily performance, and staff cost trends."