data description
تفاصيل العمل
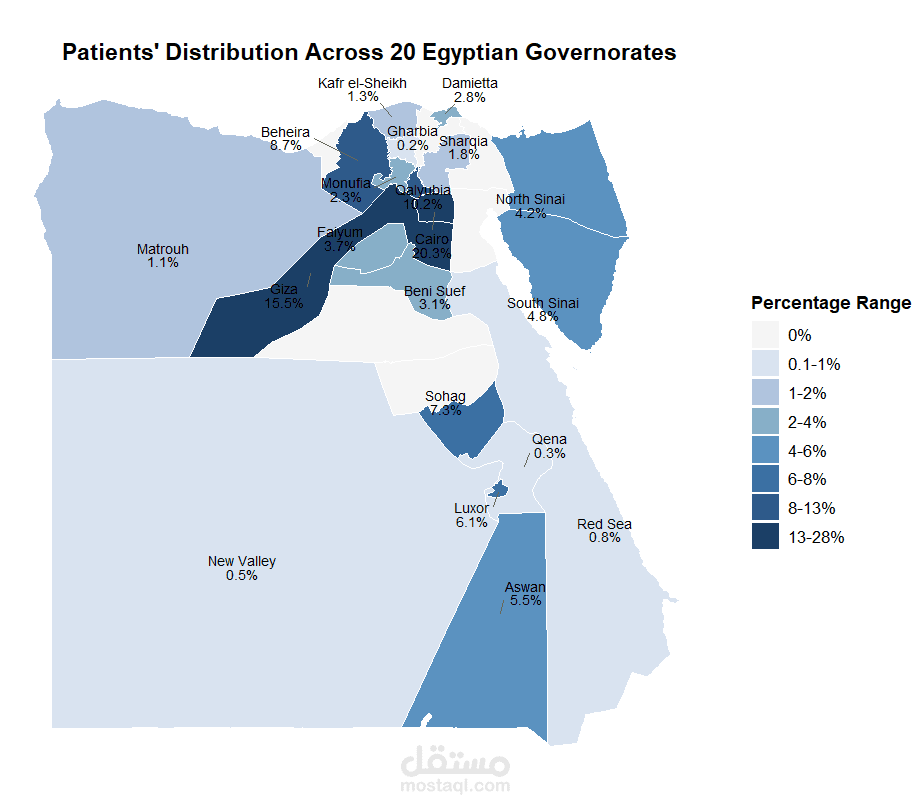
Figure X. Geographic Distribution of Study Participants Across 20 Egyptian Governorates
This map illustrates the geographic distribution of participants across 20 governorates in Egypt. The percentages of participants from each governorate are visualized using a formal color gradient ranging from light gray (representing lower proportions) to dark blue (indicating higher proportions).