Sales Super Store Analysis using Excel
تفاصيل العمل
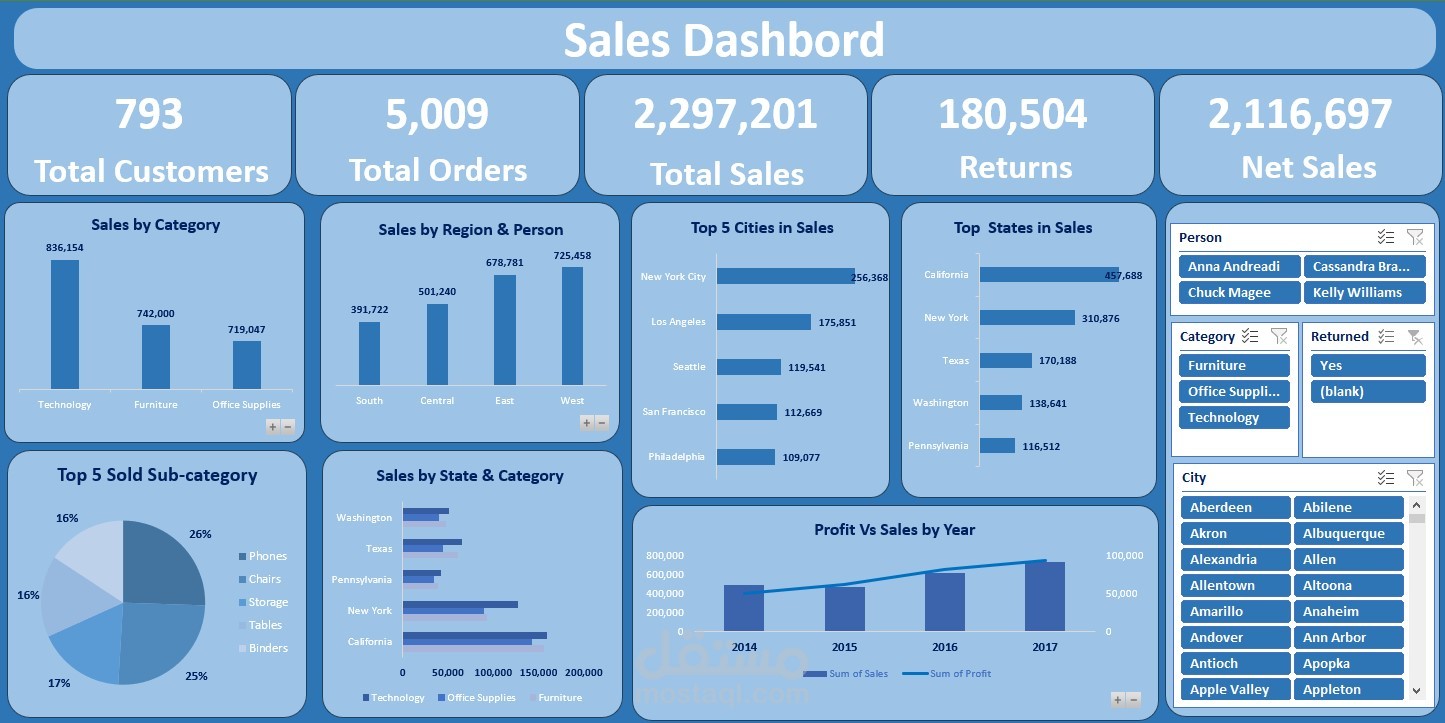
This project involves analyzing sales data from a fictional Super Store to uncover trends, identify top-performing categories, monitor shipping costs, and gain insights that can drive better business decisions. The data has been transformed and visualized using Excel features such as:
Power Query for data cleaning and preparation
Pivot Tables for summarizing key metrics
Charts and Dashboards for interactive data visualization